National Wildlife Federation
Get Your Techno On
Desert regions are hotter for multiple reasons; the lack of vegetation causes the sun's heat to go straight into the surface and the lack of moisture means none of the heat is being transferred into evaporation. This concept, and other...
National Wildlife Federation
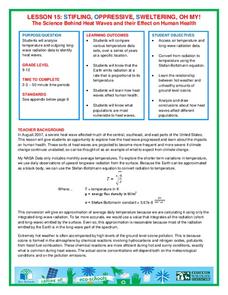
Stifling, Oppressive, Sweltering, Oh My!
Looking for a hot date? Pick any day in August, statistically the hottest month in the United States. The 15th lesson in the series of 21 instructs pupils to investigate the August 2007 heat wave through NASA data, daily temperature...
Curated OER
Cutting Expenses
Learners explore budgeting. In this finance and math lesson, students brainstorm ways in which households could save money. Learners view websites that give cost reducing ideas. Students complete an expense comparison chart and use the...
National Wildlife Federation
Wherefore Art Thou, Albedo?
In the sixth lesson in a series of 21, scholars use NASA data to graph and interpret albedo seasonally and over the course of multiple years. This allows learners to compare albedo trends to changes in sea ice with connections to the...
Curated OER
Decimals Decide Olympic Champions
The class discovers how a decimal can make all the difference in the Olympics. As they learn about decimal place values, they compare and contrast data and demonstrate decimal values using manipulatives.
John F. Kennedy Presidential Library & Museum
Red States/Blue States: Mapping the Presidential Election
Young historians investigate how voting patterns have changed by comparing the outcome of the 1960 election to the outcome of the recent election. A creative final assessment has participants making a news show wherein they provide...
Howard Hughes Medical Institute
Measuring Biodiversity in Gorongosa
Take your biology class' understanding of biodiversity to a whole new level! Ecology scholars use data to calculate three different diversity indices based on the organisms in the Gorongosa National Park. The four-part activity uses an...
Polar Trec
Ozone Data Comparison over the South Pole
Did you know the hole in the ozone is seasonal and filled by January every year? The lesson uses scientific measurements of the ozone over the South Pole to understand patterns. Scholars learn that the hole grew bigger annually before...
Carolina K-12
The Results are In! Examining Our First Vote Election
The 2016 election is over, and now it's time to dig in to some data! An activity revolves around data gathered from the First Vote Project in North Carolina wherein thousands of students voted. After diving in to the data using...
National Wildlife Federation
Why All The Wiggling on the Way Up?
Some of the CO2 emitted by burning fossil fuels is removed from the atmosphere by natural sinks, such as the ocean. The fifth engaging lesson in the series of 21 examines the CO2 data from three very different locations. It then makes a...
Curated OER
Designing the Experiment and Answering the Question
Learners investigate scientific methods by analyzing an article from the Natural Inquirer. In this data analysis lesson, students read an article from the magazine and discuss at least 2 scientific methods that could be used to...
Museum of Tolerance
Why is This True?
Are wages based on race? On gender? Class members research wages for workers according to race and gender, create graphs and charts of their data, and compute differences by percentages. They then share their findings with adults and...
World History Digital Education Foundation, Inc.
COVID-19: Comparison with the Influenza Pandemic of 1918
A timely lesson uses documentation from the Spanish influenza pandemic of 1918 to compare it to the COVID-19 pandemic in 2020. Scholars watch a short video, analyze sources, complete a worksheet, and write a claim with supporting...
Fluence Learning
Writing About Literature: Comparing and Contrasting Characters in Heidi
Scholars read excerpts from the story, Heidi, in a three-part assessment that focuses on comparing and contrasting characters. Each part contains three tasks that challenge learners to discuss, answer comprehension...
Curated OER
Misleading Graphs
Students explore number relationships by participating in a data collection activity. In this statistics lesson, students participate in a role-play activitiy in which they own a scrap material storefront that must replenish its...
Curated OER
Canada's Climate: Temperature and Rainfall Variations
Learners analyze data about various climates in Canada. In this data analysis and climate activity, students use Canada Year Book 1999 to complete a worksheet and make connections between precipitation and temperature in different climates.
NASA
Discovering the Milky Way
What do you call a tiny collection of galaxies? A puny-verse! Young scholars graph data gathered by scientists studying Cepheids. They attempt to identify a relationship between the variables through standard and logarithmical...
Curated OER
Calculating the Cost of a "Sound Basic Education"
Students state their opinions about school funding and the use of monetary resources by school districts and use reasons, facts, and examples to support their ideas. They compare sets of data related to school funding and draw...
Curated OER
Graphing the Diversity of a Forest
Second graders work in groups to identify what types of trees create which types of leaves In this plant life lesson plan, 2nd graders analyze a set of leaves and identify the tree it came from while graphing the data in a science...
Social Media Toolbox
Social Media Survey
Survey says ... social media is here to stay! How do the pupils in your school use social media? Using activity four from a 16-part series, The Social Media Toolbox, learners study surveys and create their own. The resource includes...
Curated OER
The Frozen Desert: Graphing and Comparing Climates
Students explore the concept of climate. They use temperature and precipitation data from their area and other regions to construct climate graphs. These graphs are used to help identify factors that influence climate.
Curated OER
Origami Flight: The Physical Setting
Sixth graders investigate the forces that move certain objects. In this physics lesson, 6th graders design and create paper flying objects using origami methods, which they practice flying in different conditions. Students...
Curated OER
Photosynthesis
Students recognize the importance of plants as they perform an experiment involving photosynthesis. Students determine the optimum wavelength of light for photosynthesis by exposing plants to different colors of light, collecting data,...
US Department of Commerce
Changes in My State
So much can change in seven years. Young statisticians choose three types of businesses, such as toy stores and amusement parks, and use census data to determine how the number of those businesses in their state changed between 2010 to...

