National Wildlife Federation
Get Your Techno On
Desert regions are hotter for multiple reasons; the lack of vegetation causes the sun's heat to go straight into the surface and the lack of moisture means none of the heat is being transferred into evaporation. This concept, and other...
Howard Hughes Medical Institute
Measuring Biodiversity in Gorongosa
Take your biology class' understanding of biodiversity to a whole new level! Ecology scholars use data to calculate three different diversity indices based on the organisms in the Gorongosa National Park. The four-part activity uses an...
Fluence Learning
Writing About Literature: Comparing and Contrasting Characters in Heidi
Scholars read excerpts from the story, Heidi, in a three-part assessment that focuses on comparing and contrasting characters. Each part contains three tasks that challenge learners to discuss, answer comprehension...
Curated OER
Misleading Graphs
Students explore number relationships by participating in a data collection activity. In this statistics lesson, students participate in a role-play activitiy in which they own a scrap material storefront that must replenish its...
Curated OER
Feeding in the Flow
The National Oceanic and Atmospheric Administration (NOAA) has developed a tremendous library of ocean-themed lessons that can be used in a variety of science settings. "Feeding in the Flow" is one of those activities; Its focus is on...
Curated OER
Pick A Short Story
Students select a short story and apply various literary elements they have used throughout the year. They deconstruct a short story according to plot, setting, characterization, and theme. Students create a PowerPoint.
Curated OER
Real Estate Lesson: Monthly Payments
Students examine real-world data relating to real estate. They conduct Internet research, record data regarding real estate in major cities, graph the data, calculate mortgage payments using a mortgage calculator, and analyze the data.
Columbus City Schools
Making Waves
Learning about waves can have its ups and downs, but a demo-packed tool kit has the class "standing" for more! Learners gain experience with several different wave types, organizing observations and data, and wave...
Fluence Learning
Writing About Literature: Nature in the Writings of John Muir and Emily Dickinson
As an assessment of their skill in crafting a compare and contrast essay, class members read and compare the portrayals of nature in excerpts from naturalist John Muir's My First Summer in the Sierra and from poet Emily Dickinson's...
National Wildlife Federation
I Speak for the Polar Bears!
Climate change and weather extremes impact every species, but this lesson plan focuses on how these changes effect polar bears. After learning about the animal, scholars create maps of snow-ice coverage and examine the yearly variability...
Curated OER
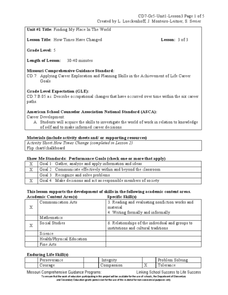
How Times Have Changed
Fifth graders work in small groups to compile job changes. They use data from the list of changes that the group generated together. Students analyze the data to determine: categories of changes, patterns or trends of changes, and future...
Curated OER
How Has Transportation Changed Since the 1899 Harriman Alaska Expedition?
Students recognize modes of transportation. They research historical data from a variety of primary and secondary sources including the Harriman expedition journals, related web sites, and photographs from the expedition. Students...
Curated OER
What Are the Layers of the Rain Forest?
Students investigate the different levels of the rain forest by comparing it to an apartment. In this ecology lesson, students practice using forest related vocabulary words and complete a vocabulary data sheet. Students...
Curated OER
Roman Archy
Third graders use Google Earth to examine Roman architecture. In this ancient Rome lesson, 3rd graders visit the noted URLs to look at examples of Roman architecture. Students work in teams to examine data about the structures.
Curated OER
Calculating the Cost of a "Sound Basic Education"
Students state their opinions about school funding and the use of monetary resources by school districts and use reasons, facts, and examples to support their ideas. They compare sets of data related to school funding and draw...
Curated OER
Extraction of Caffeine from Tea Leaves
Students conduct an experiment in which they extract the greatest number of grams of caffeine from four bags of tea. They conduct Internet research, conduct the experiment, and record their observations and data.
Curated OER
Who is the Sea Otter Related to?
Students examine the genetic relationships of different organisms. In groups, they discover the importance of genes and how different amino acids show various evolutionary relationships. They use an online database to continue their...
Curated OER
Monitoring an Epidemic: Analyzing Through Graphical Displays Factors Relating to the Spread of HIV/AIDS
Tenth graders differentiate pandemic and epidemic. In this health science lesson, 10th graders analyze how HIV and AIDS affect different countries. They construct and interpret different types of graphs.
Curated OER
Family Life in the 1830s
Students compare and contrast family life today with family life in the 1830s. They conduct research on Old Sturbridge Village, read primary source documents, and develop a list of generalizations comparing/contrasting families of the...
Curated OER
Poll Positions
Students analyze and graph the results of a nationwide New York Times poll about race in the United States. They poll people in their community regarding their views and experiences, and compare and contrast local and national poll data.
Curated OER
Bioterrorism: Development of a "Superbug"
Students compare bacteria and viruses and their roles in biotechnology and bioterrorism. They outline fundamental steps of bacterial transformation and the possible selection processes to identify transformants. They discuss...
NASA
Space-Based Astronomy on the Internet
Young scientists compile everything they have learned into a report in the fifth and final lesson in a unit on the visible light spectrum. Access to photos from observatories, telescopes, and satellites allows learners to compare...
Curated OER
Global Warming Part 2: Climate Change
Students examine natural climate fluctuations of the Earth and compare climate change in last 100 years to earlier climate changes. From this data students will begin to define current issues related to global warming.
Curated OER
Exploring Literature and Weather through Chirps
Students explore and experience information about temperature changes by using crickets' chirps to calculate the temperature. The data is applied to formula and the temperatures are calculated.


