NASA
Hurricanes as Heat Engines
Hurricanes are a destructive yet fascinating phenomenon. Individuals examine evidence that hurricanes use thermal energy from the ocean as they approach land. Learners use images, charts, and graphs to collect data and then draw...
Curated OER
Using Charts and Graphs to Study East Asia's Modern Economy
Students examine East Asia's modern economy. In groups, classmates use the internet to compare the resources, products, and economy of specified countries. After collecting the data, pupils create charts, tables and graphs. They...
Curated OER
Songs from the Past
Learners research songs from the past to learn about historical events. In this music history lesson plan, students conduct a survey on the Star-Spangled Banner, research the song and history on various websites, and research songs in...
Curated OER
Surviving AIDS
Enhance your middle and high schoolers' research skills with this lesson plan. After viewing a video clip about HIV and AIDS, high schoolers identify the facts and issues surrounding the disease. They work together to create a newspaper...
Curated OER
Student Costs Data Table
Young scholars compare and contrast two routes selected for a virtual field trip. They create a data table of educational activities, lodging, and meal costs using Microsoft Excel software.
Curated OER
Charting Seasonal Changes
Students research the Earth's patterns of rotation and revolution, create a chart and graph of these patterns and use them to explain the causes of night and day and summer and winter.
Columbus City Schools
Totally Tides
Surf's up, big kahunas! How do surfers know when the big waves will appear? They use science! Over the course of five days, dive in to the inner workings of tidal waves and learn to predict sea levels with the moon as your guide.
Curated OER
East Asia Country Project
Get your young historians thinking about East Asian culture and history during this partner research project, in which they analyze a variety of East Asian aspects to prepare for a presentation. After an initial "what do we already know"...
Curated OER
Chart This!
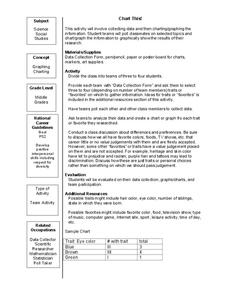
Students collect data and graph or chart the information. In this data organization lesson plan, students poll their classmates about certain topics and chart or graph the information to show the results of their research.
Curated OER
Understanding "The Stans"
Students explore and locate "The Stans" in Central Asia to create, write and illustrate maps, graphs and charts to organize geographic information. They analyze the historical and physical characteristics of Central Asia via graphic...
Curated OER
A Research Project and Article For the Natural Inquirer
Get your class to use the scientific process to solve a scientific problem. They utilize the Natural Inquirer magazine to identify a research question which they write an introduction to and collect data to answer. They use graphs,...
Curated OER
Snow Cover By Latitude
Young scholars create graphs comparing the amount of snow cover along selected latitudes using data sets from a NASA website. They create a spreadsheet and a bar graph on the computer, and analyze the data.
Curated OER
Weather Report Chart
Students complete a weather report chart after studying weather patterns for a period of time. In this weather report instructional activity, students measure temperature, precipitation, cloud cover, wind speed, and wind direction for a...
Curated OER
Graph Both Crusts
Fourth graders calculate the angles and construct a pie graph of the percentages of the elements in the continental and oceanic crusts. Then they analyze the results. They can be assigned the task of researching the percentages.
Curated OER
Creation and Interpretation of Voter Participation Graph
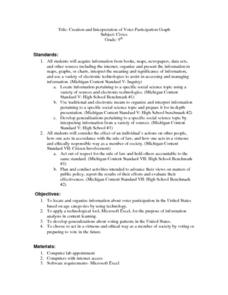
Ninth graders research information about voter participation in the United States based on age. They develop generalizations about voting patterns in the U.S and use Microsoft Excel to analyze the information.
Curated OER
Social Studies: Analyzing Massachusetts Immigration
Young scholars investigate immigration in Massachusetts during the 1990's. They research a series of questions pertaining to immigration, including their experiences, obstacles, and countries of origin. They graph the five most...
Curated OER
Ornithology and Real World Science
Double click that mouse because you just found an amazing lesson! This cross-curricular Ornithology lesson incorporates literature, writing, reading informational text, data collection, scientific inquiry, Internet research, art, and...
Curated OER
Synthesis of Information
Locating and synthesizing information is an essential part of the research process but can be overwhelming for many young writers. Eliminate some of the stress and confusion, this resource suggests, by separating these steps. To focus...
Curated OER
Examine Methods of Reporting Research Results
Students analyze a research report and the list of components needed in a research report and then identify those components based on a set of standards using the scientific method. They collect data which can be used for a graphical...
Curated OER
MAISA and the REMC Association of Michigan
Students complete online research to study geography's impact on weather. In this geography and weather lesson, students research weather in their city for ten days using an online website. Students bookmark the site, enter data into a...
Curated OER
Shake, Rattle and Roll
Sixth graders explore the causes and effects of earthquakes. They also collect and analyze data in graphs. They also use the Internet to research earthquakes
Curated OER
The Study of the Spanish-Speaking People of Texas: Understanding Photo Essays
Students analyze a photo essay of the Spanish-Speaking People of Texas by the photojournalist Russell Lee. They identify the goals of the photo essay, explore a website, and complete a worksheet.
Curated OER
Why War? Causes of the American Revolution and South Carolina's Role
Eighth graders investigate the role of South Carolina in the American Revolution. In this colonial American lesson, 8th graders analyze primary documents and images to determine how the state was involved in the outbreak of the war and...
Curated OER
Weather, Sea Level Rise and Climate Change
Eighth graders compare and contrast weather and climate. In this earth science lesson, 8th graders research weather data site and analyze historical data. They present their findings in class and explain identifiable trends.


