CK-12 Foundation
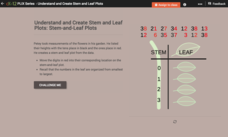
Understand and Create Stem-and-Leaf Plots: Stem-and-Leaf Plots
Explore the advantages to using a stem-and-leaf plot using an online lesson. Learners manipulate an animation to create a stem-and-leaf plot. They then calculate statistics for the data using their display. Guiding questions help them...
CK-12 Foundation
Understand and Create Stem-and-Leaf Plots: Event Survey
A good lesson doesn't just grow on trees! Help your classes understand the concept of a stem-and-leaf plot using an interactive lesson. Learners first create a stem-and-leaf plot from a set of data by dragging the values to the...
CK-12 Foundation
Two-Sided Stem-and-Lead Plots: Gamers
Which gender spends more time playing video games? Your classes use provided data to answer this question. They first build a two-sided stem-and-leaf plot and then use the display to look for patterns. Guiding questions help them...
CK-12 Foundation
Stem-and-Leaf Plots and Histograms: Digital Photography
Cameras use histograms to communicate the exposure of a photograph. An interesting lesson uses this idea to help learners deepen their understanding of histograms. It highlights the skew of the graphs by showing under- and overexposed...
Curated OER
Introduction to Representing and Analyzing Data
Represent data graphically. Allow your class to explore different methods of representing data. They create foldables, sing songs, and play a dice game to reinforce the measures of central tendency.
Curated OER
Tag It and Bag It: Archeology Lab Lesson
Seventh graders practice analyzing, collecting and categorizing artifacts. Using charts, they organize and interpret information about the artifacts they classified. They work together to create a graph to represent class totals and...


