CK-12 Foundation
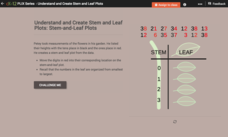
Understand and Create Stem-and-Leaf Plots: Stem-and-Leaf Plots
Explore the advantages to using a stem-and-leaf plot using an online lesson. Learners manipulate an animation to create a stem-and-leaf plot. They then calculate statistics for the data using their display. Guiding questions help them...
CK-12 Foundation
Understand and Create Stem-and-Leaf Plots: Event Survey
A good lesson doesn't just grow on trees! Help your classes understand the concept of a stem-and-leaf plot using an interactive lesson. Learners first create a stem-and-leaf plot from a set of data by dragging the values to the...
CK-12 Foundation
Two-Sided Stem-and-Lead Plots: Gamers
Which gender spends more time playing video games? Your classes use provided data to answer this question. They first build a two-sided stem-and-leaf plot and then use the display to look for patterns. Guiding questions help them...
Curated OER
Frequency Tables and Stem-and-Leaf Plots
Students are introduced to the function of frequency tables and stem and leaf plots. In groups, they determine the frequency of their teacher coughing, ringing a bell or raising their hand. To end the instructional activity, they...
CK-12 Foundation
Stem-and-Leaf Plots and Histograms: Digital Photography
Cameras use histograms to communicate the exposure of a photograph. An interesting lesson uses this idea to help learners deepen their understanding of histograms. It highlights the skew of the graphs by showing under- and overexposed...
Curated OER
Dealing with Data
Seventh graders collect and analyze data. In the seventh grade data analysis instructional activity, 7th graders explore and/or create frequency tables, multiple bar graphs, circle graphs, pictographs, histograms, line plots, stem...
Curated OER
Stem and Leaf Plots and Circle Graphs
Students graph and plot numbers and analyze their data. In this algebra lesson, students identify the different properties of a stem and leaf plot. They decide which type of graph to use when it comes time to analyze their data.
Curated OER
The Dog Days of Data
Students are introduced to the organization of data This lesson is designed using stem and leaf plots. After gather data, they create a visual representation of their data through the use of a stem and leaf plot. Students
drawing...
Curated OER
How Tall is the Average 6th Grader?
Upper grade and middle schoolers explore mathematics by participating in a measuring activity. They hypothesize on what the average height of a male or female 6th grader is and identify ways to find the average mathematically. Learners...
Alabama Learning Exchange
Why Roots, Stems, and Leaves are Important
Young scholars use the Internet to research the importance of leaves, stems and roots to plants. They participate in a hands-on experiment to identify the functions of different plant parts.
Curated OER
Introduction to Representing and Analyzing Data
Represent data graphically. Allow your class to explore different methods of representing data. They create foldables, sing songs, and play a dice game to reinforce the measures of central tendency.
Curated OER
Flicking Football Fun
Young mathematicians fold and flick their way to a deeper understanding of statistics with a fun, hands-on math unit. Over the course of four lessons, students use paper footballs to generate data as they learn how to create line...
Curated OER
Drops on a Penny
Eighth graders experiment to determine the number of drops of water a heads up penny hold. They create a stem and leaf graph of the class results and use the data for further experimentation on a tails up penny.
Curated OER
Statistics with State Names
Students analyze the number of times each letter in the alphabet is used in the names of the states. In this statistics lesson, students create a stem and leaf plot, box and whisker plot and a histogram to analyze their data.
Curated OER
Leaf Straw
High schoolers investigate plant structure and the process of photosynthesis. Using everyday items, they demonstrate that the leaves and stems of plants can act like a straw. In addition, they identify plant structure.
Curated OER
Plants
Students illustrate the major parts of a plant, classify some plant foods we eat as roots, stems, leaves, flowers, fruits and seeds. They also name some animals that use seeds, leaves, and fruit for food.
Curated OER
Interpreting and Displaying Sets of Data
Students explore the concept of interpreting data. In this interpreting data lesson, students make a line plot of themselves according to the number of cubes they can hold in their hand. Students create their own data to graph and...
Curated OER
Leaf Identification
Students identify different leaf types. They examine their patterns, shapes and colors. They complete a worksheet to end the lesson.
Curated OER
Plant Observation and Morphology
Learners use plant specimens to explore how to recognize differences in plant morphology and to develop a vocabulary to describe these differences. They brainstorm: What is a plant? What parts do plants have? What is a leaf? Students...
Curated OER
Probability Popsicle Pop-ups
Fourth graders decorate and use popsicle sticks as manipulatives to assist with their learning of probability. They utilize a worksheet imbedded in this plan to organize the results of their experiment. They make a stem and leaf plot...
Curated OER
Acid Rain Effects
Get out the goggles and conduct a simple experiment to model and explore the harmful effects of acid rain (vinegar) on living (green leaf and eggshell) and non-living (paper clip) objects. Young chemists observe and describe the harmful...
Curated OER
Prairie Find Outdoors
Learners take a field trip to a local prairie. Using identification books, they identify various forbs and grasses in the prairie. As a class, they discuss the importance of forbs and grasses to the ecosystem and review the various types...
Curated OER
A Leaf, a Stem, a Root, Oh My!
Students conduct Internet research on plants and complete a WebQuest on vegetable plants. They use a graphic organizer to display their findings, observe actual vegetables and design a salad, noting which part of each plant is included.
Curated OER
Keys To Trees: Dichotomous Tree Identification
Ninth graders gather samples of different tree leaves in their neighborhoods, and on school grounds, and identify several species of common South Carolina trees using leaf and growth characteristics with aid of dichotomous key.
Other popular searches
- Stem and Leaf Plots
- Stem and Leaf Plots
- Stem & Leaf Graph
- Stem Leaf Plots
- Math Stem and Leaf Plots
- Stem and Leaf Graphs
- Creating Stem and Leaf Plot
- Stem and Leaf Plot Images
- Back Stem and Leaf
- Stem and Leaf Diagrams
- Stem Leaf Graph
