EngageNY
Using Linear Models in a Data Context
Practice using linear models to answer a question of interest. The 12th installment of a 16-part module combines many of the skills from previous lessons. It has scholars draw scatter plots and trend lines, develop linear models, and...
EngageNY
Using a Curve to Model a Data Distribution
Show scholars the importance of recognizing a normal curve within a set of data. Learners analyze normal curves and calculate mean and standard deviation.
EngageNY
Making Scale Drawings Using the Ratio Method
Is that drawn to scale? Capture the artistry of geometry using the ratio method to create dilations. Mathematicians use a center and ratio to create a scaled drawing. They then use a ruler and protractor to verify measurements.
EngageNY
Using Sample Data to Estimate a Population Characteristic
How many of the pupils at your school think selling soda would be a good idea? Show learners how to develop a study to answer questions like these! The lesson explores the meaning of a population versus a sample and how to interpret the...
EngageNY
Building Logarithmic Tables
Thank goodness we have calculators to compute logarithms. Pupils use calculators to create logarithmic tables to estimate values and use these tables to discover patterns (properties). The second half of the lesson plan has scholars use...
EngageNY
Calculating Conditional Probabilities and Evaluating Independence Using Two-Way Tables (part 1)
Being a statistician means never having to say you're certain! Learners develop two-way frequency tables and calculate conditional and independent probabilities. They understand probability as a method of making a prediction.
EngageNY
Comparison of Numbers Written in Scientific Notation and Interpreting Scientific Notation Using Technology
Examine numbers in scientific notation as a comparison of size. The 14th lesson in the series asks learners to rewrite numbers as the same power of 10 in scientific notation to make comparisons. Pupils also learn how to use a calculator...
EngageNY
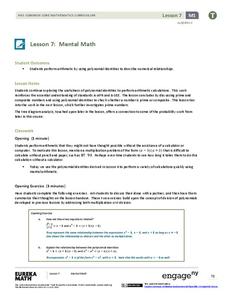
Mental Math
Faster than a speedy calculator! Show your classes how to use polynomial identities to multiply numbers quickly using mental math.
Achieve
BMI Calculations
Obesity is a worldwide concern. Using survey results, learners compare local BMI statistics to celebrity BMI statistics. Scholars create box plots of the data, make observations about the shape and spread of the data, and examine the...
EngageNY
Using Trigonometry to Determine Area
What do you do when you don't think you have enough information? You look for another way to do the problem! Pupils combine what they know about finding the area of a triangle and trigonometry to determine triangle area when they don't...
Curated OER
Representing Numbers Using Scientific Notation
Learners explore the concept of scientific notation. For this scientific notation lesson, mathematicians discuss how multiplying by a power of 10 affects the decimal. They play Powers of 10 Yahtzee. Students roll a die five times and...
Texas Instruments
TI-Nspire™ CAS
When it comes to rating educational calculators, this calculator is always near the top of this list. Now it's available as an app. There is a lot of calculator power wrapped up in this app. Not only is this a fully functioning...
101 Questions
Amazon Percent Discount
Everyone loves a good sale! A straightforward lesson provides practice with calculating a percent off of a product. Using ads from Amazon, individuals calculate the percent off the ad does not show. Pupils see the answer after revealing...
Utah Education Network (UEN)
Linear Graphs Using Proportions and Rates
Using a TI-73 or other similar graphing calculator middle school math majors investigate the linear relationship of equivalent proportions. After a brief introduction by the teacher, class members participate in a timed pair share...
EngageNY
From Circle-ometry to Trigonometry
Can you use triangles to create a circle? Learners develop the unit circle using right triangle trigonometry. They then use the unit circle to evaluate common sine and cosine values.
Mrs. Burke's Math Page
Let Them Eat Pi
Looking for a fun and creative way to celebrate Pi Day? Then this is the resource for you. From a scavenger hunt and trivia contest to PowerPoint presentations and skills practice worksheets, this collection of materials is a...
Curated OER
Exploring the FTC using the TI
Students use the Fundamental Theorem of Calculus to solve problems. In this calculus lesson, students use the TI to solve the graphing porting of the problem. They practice graphing functions and discuss their place in the real world.
Curated OER
Square Roots Using a Carpenter's Square
Middle schoolers calculate the square root of a given number using carpenter's square measurements. In this math instructional activity, students relate this method on the Pythagorean theorem. They answer practice problems after the...
Curated OER
Green Classroom Audit
Students audit their classroom for environmentally friendly practices. In this "green" lesson, students take an inventory of the classroom and identify ways to improve practices. Students complete a worksheet, brainstorm new ideas for...
Curated OER
Energy Audit
Young scholars collect data about energy usage and use mathematical calculations to analyze their data. In this energy conservation and statistics math lesson, students survey their homes to complete an energy usage worksheet. Young...
Mathematics Vision Project
Module 5: Modeling with Geometry
Solids come in many shapes and sizes. Using geometry, scholars create two-dimensional cross-sections of various three-dimensional objects. They develop the lesson further by finding the volume of solids. The module then shifts...
EngageNY
Margin of Error When Estimating a Population Mean (part 1)
We know that sample data varies — it's time to quantify that variability! After calculating a sample mean, pupils calculate the margin of error. They repeat the process with a greater number of sample means and compare the results.
EngageNY
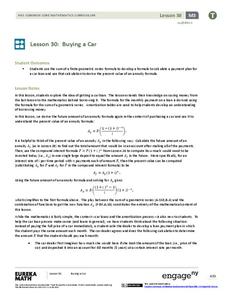
Buying a Car
Future car owners use geometric sums to calculate payments for a car loan in the 31st installment of a 35-part module. These same concepts provide the basis for calculating annuity payments.
EngageNY
Events and Venn Diagrams
Time for statistics and learning to overlap! Learners examine Venn Diagrams as a means to organize data. They then use the diagrams to calculate simple and compound probabilities.


