EngageNY
Real-World Area Problems
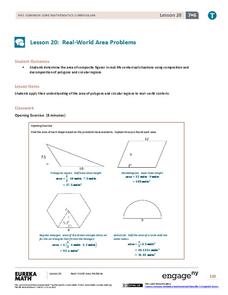
Not all structures take the shape of a polygon. The 21st lesson in a series of 29 shows young mathematicians they can create polygons out of composite shapes. Once they deconstruct the structures, they find the area of the composite figure.
North Carolina State University
Exploring Genetics Across the Middle School Science and Math Curricula
Where is a geneticist's favorite place to swim? A gene pool. Young geneticists complete hands-on activities, experiments, and real-world problem solving throughout the unit. With extra focus on dominant and recessive genes, Punnett...
Curated OER
Making Connections: Matrices, Graph, Linear Systems
In this set of activities, matrices and equations are explored. They work with matrices using pen and paper as well as graphing calculator. Additionally real-world problems are explored.
Radford University
Parallel Lines, Transversals, and Angles: What’s the Connection?
Streets, bridges, and intersections, oh my! Parallel lines and transversals are a present in the world around us. Learners begin by discovering the relationship of the angles formed by parallel lines and a transversal. They then...
EngageNY
Modeling Linear Relationships
Math modeling is made easy with the first installment of a 16-part module that teaches pupils to model real-world situations as linear relationships. They create graphs, tables of values, and equations given verbal descriptions.
Curated OER
Slope, Vectors, and Wind Pressure
A hands-on lesson using the TI-CBR Motion Detector to provide information to graph and analyze. The class uses this information to calculate the slope of motion graphs and differentiate scalar and vector quantities. There is a real-world...
Illustrative Mathematics
Voting for Three, Variation 1
This is an opportunity for young mathematicians to apply reasoning to solve real-world problems with ratios. Even though there are three candidates for class president, students will only consider two at a time, making the first problem...
Curated OER
Sunrise, Sunset
What locations on Earth get the longest number of hours of daylight in the summer? Hint: It's not the equator! Use real-world sunrise and sunset data to develop trigonometric models that can be used to estimate the number of hours of...
Curated OER
Matrix Analysis of Networks
Explore the connection between a finite graph, a directed graph, and a matrix. Graph lines and identify the relationship of matrices in real-world scenarios. Then use this information to work with a partner to plan and design a...
EngageNY
Interpreting the Graph of a Function
Groups sort through NASA data provided in a graphic to create a graph using uniform units and intervals. Individuals then make connections to the increasing, decreasing, and constant intervals of the graph and relate these...
EngageNY
The Motion of the Moon, Sun, and Stars—Motivating Mathematics
What does math have to do with the behavior of the earth and sun? Learn how the movement of celestial bodies has influenced the development of trigonometry. Scholars connects the details in mathematics to their...
Curated OER
Real World Problems
Eighth graders solve real world problems. For this solving real world problems lesson, 8th graders decorate a school cafeteria for a dance. Students determine the number of balloons needed to put a balloon every foot for the...
Curated OER
Math in Your Life
Examine how math fits into everyday lives by writing mathematical word problems and answering them. Middle schoolers will also practice their test taking skills utilizing different kinds of tests.
Curated OER
Snow Day
It's a snow day, and two brothers attending schools with different schedules each got a late start to the day. But who had the shorter school day? That's what your class will find out as they apply their knowledge of fractions to this...
EngageNY
Graphing Quadratic Functions from Factored Form
How do you graph a quadratic function efficiently? Explore graphing quadratic functions by writing in intercept form with a instructional activity that makes a strong connection to the symmetry of the graph and its key features before...
Radford University
The Pythagorean Theorem in Crime Scene Investigation
It's a Pythagorean who-dun-it. Pupils apply the Pythagorean Theorem in several different real-world scenarios involving right triangles. By solving each task, they find the thief who was responsible for a museum heist.
Curated OER
Videobusters
A real-world scenario, Videobusters, a video rental store has just got to get organized. In small groups, the class works on organizing and analyzing data utilizing matrices. They need to use their skills in adding, subtracting and...
EngageNY
Graphs of Quadratic Functions
How high is too high for a belly flop? Learners analyze data to model the world record belly flop using a quadratic equation. They create a graph and analyze the key features and apply them to the context of the video.
Education Development Center
Geography of the Coordinate Plane
Put the graph into graphing and allow learners to understand the concept of point plotting and how it relates to data. The worksheet provides a nice way to connect data analysis to a graph and make predictions. The worksheets within...
Texas Instruments
TI-Nspire™ CAS
When it comes to rating educational calculators, this calculator is always near the top of this list. Now it's available as an app. There is a lot of calculator power wrapped up in this app. Not only is this a fully functioning...
Texas Instruments
TI-Nspire™
We landed on the moon with less computing capabilities than you can find in this app! Here is a multiple function calculator that takes all the power you get from a handheld and adds the wonderful large screen that only a tablet can...
Curated OER
Problem Solving Using Math
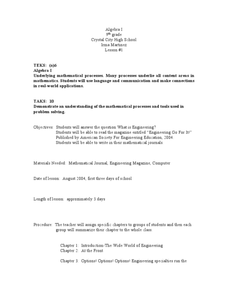
Students solve real life scenarios using algebra. In this word problem activity, students use different websites dealing with engineering as it relates to the real world and math. They use other resources such as magazines to solve word...
Illustrative Mathematics
Chocolate Bar Sales
In this real-world example, algebra learners start to get a sense of how to represent the relationship between two variables in different ways. They start by looking at a partial table of values that define a linear relationship. They...
Kenan Fellows
Lego Thinking and Building
Run a simulated airplane manufacturing plant with your pupils as the builders! Learners build Lego airplane models and collect data on the rate of production, comparing the number produced to the number defective. Using linear...


