Curated OER
Graphing Parabolas and Circles
Students graph parabolas and circles. In this algebra lesson, students create a table of values and graph the coordinate pairs to create a graph. They graph a circle using the radius and center.
Curated OER
Investigating Linear Equations Using Graphing Calculator
Learners investigate linear equations using the Ti-Calculator. In this algebra instructional activity, students graph lines and identify the different quadrants on a coordinate plane. They identify ordered pairs used to plot lines.
Curated OER
Functions and the Vertical Line Test
Students examine functions and function notation. They use computer activities to discover how to graph functions, and conduct a vertical line test. Students describe spatial relationships using coordinate geometry.
Curated OER
Comparing Costs
Students compare the costs of two cellular phone plans and determine the best rate. They use a table and a graph of points plotted on a Cartesian plane to display their findings. Students write an equation containing variables that could...
Mathematics TEKS Toolkit
Grade 6: Exploring c/d = pi
Introduce your math class to the perimeter of a circle. Teach them that pi describes the relationship between the circumference and the diameter. As a hands-on investigation, pairs or small groups use string to compare these two values...
Curated OER
Geometry and Geoboard
Sixth graders use geoboards and dot paper to experiment with geometric concepts. In this geometry lesson, 6th graders complete four activities using geoboards or dot paper including naming points on a coordinate plan and finding the area...
Curated OER
Generating Points and Graphing
Students create a table of values to help them plot. In this algebra lesson, students plot their points on a coordinate plane creating a graph. They observe and analyze linear functions.
EngageNY
Lines That Pass Through Regions
Good things happen when algebra and geometry get together! Continue the exploration of coordinate geometry in the third lesson in the series. Pupils explore linear equations and describe the points of intersection with a given polygon as...
EngageNY
Dividing Segments Proportionately
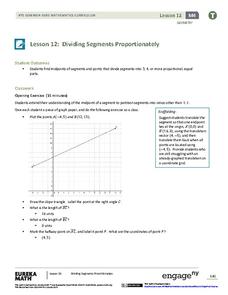
Fractions, ratios, and proportions: what do they have to do with segments? Scholars discover the midpoint formula through coordinate geometry. Next, they expand on the formula to apply it to dividing the segment into different ratios and...
EngageNY
Perimeter and Area of Polygonal Regions Defined by Systems of Inequalities
When algebra and geometry get together, good things happen! Given a system of inequalities that create a quadrilateral, learners graph and find vertices. They then use the vertices and Green's Theorem to find the area and perimeter of...
EngageNY
Segments That Meet at Right Angles
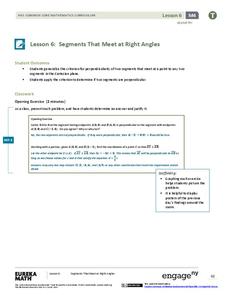
Can segments be considered perpendicular if they don't intersect? Learners look at nonintersecting segments on the coordinate plane and make conclusions about the lines that contain those segments. They determine if they are...
Curated OER
Narrow Corridor
Buying a new sofa? Learn how to use the Pythagorean Theorem, as well as algebra and graphing techniques, to determine whether the sofa will fit around a corner (which I'm sure you'll agree is a very important consideration!).
Achieve
Rabbit Food
Keep your pets slim, trim, and healthy using mathematics! Pupils use a linear programming model to optimize the amount and type of food to provide to a pet rabbit. They model constraints by graphing inequalities and use them to analyze a...
California Mathematics Project
Reflections
Reflections are the geometric mirror. Pupils explore this concept as they discover the properties of reflections. They focus on the coordinates of the reflections and look for patterns. This is the third lesson in a seven-part series.
Curated OER
Lines in the Coordinate Plane
Young scholars graph lines in a coordinate plane. In this geometry lesson, students graph lines on a coordinate plane, and identify the slope. They classify the lines as parallel or perpendicular and write an equation of a given line.
Curated OER
Graphing Data
Young scholars graph lines in a coordinate plane. In this geometry instructional activity, students graph lines on a coordinate plane, and identify the slope. They calculate the volume, area and perimeters of the shapes created on a...
Curated OER
Ordered Pairs on a Coordinate Plane
Seventh graders identify the quadrants and axis of a coordinate plane. For this algebra lesson, 7th graders discover the correct way to graph using the coordinate plane. They discuss the relationship between x and y values, domain and...
Curated OER
Solving Systems by Graphing
Students solve systems of equation through graphing. In this algebra lesson, students solve linear equations and analyze the result to figure out if there is one solution, no solution or infinitely many solutions. They graph their lines...
Texas Instruments
Graphing Calculator Investigation Graphs of Relations
Learners investigate relations in this algebra lesson. They graph the set of ordered pairs that determine a relation. Using a TI-83 Plus, your learners will enter the coordinates in a list, create a scatter plot, and manipulate the...
Curated OER
Data Collection and Graphing
Students collect data and graph it on a coordinate plane and analyze it. In this statistics lesson plan, students display their data collection using a graph. They determine which central tendency will work best.
Curated OER
More Graphing Situations by Making a Table
Students calculate rate of change and graph linear functions. In this algebra lesson students write linear functions, make a table of points and graph their data on a coordinate plane. They calculate the rate of change of a graph.
Curated OER
Matrix Madness!!
Perform operations to add, subtract, multiply and divide matrices. Then solve problems with vectors using matrices. A three day lesson: Matrix Madness, Mystical Matrices, and Decode the Encode. The last lesson has prizes that the class...
Education Development Center
Points, Slopes, and Lines
Before graphing and finding distances, learners investigate the coordinate plane and look at patterns related to plotted points. Points are plotted and the goal is to look at the horizontal and vertical distances between coordinates and...
Curated OER
Linear Inequalities in One and Two Variables: Rays and Half Planes
Define rays and half planes, including the concepts of boundary lines and prerequisite knowledge of coordinate planes. Given linear inequalities in one and two variables, your class will compare the differences. They will also graph...
Other popular searches
- Coordinate Graphing Pictures
- Holiday Coordinate Graphing
- Graphing Coordinate Planes
- Coordinate Graphing Worksheets
- Cartesian Graphing Pictures
- Coordinate Graphing Art
- Using Coordinate Graphing
- Coordinate Graphing Practice
- Algebra Coordinate Graphing
- Coordinate Graphing Distance
- Graphing Coordinate Pairs
- Graphing on a Coordinate Grid


