Curated OER
Drive the Data Derby
Three days of race car design and driving through the classroom while guessing probability could be a third graders dream. Learn to record car speed, distances traveled, and statistics by using calculation ranges using the mean, median,...
Curated OER
The Power of Graphical Display: How to Use Graphs to Justify a Position, Prove a Point, or Mislead the Viewer
Analyze different types of graphs with learners. They conduct a survey and determine the mean, median and mode. They then identify different techniques for collecting data.
Curated OER
State Names: Frequency
Data grathers determine the frequency of specified data. They identify the frequency that specified letters occur in the names of all 50 states. They create stem-and-leaf plots, box-and-whisket plots and historgrams to illustrate the data.
Curated OER
Using Graphical Displays to Depict Health Trends in America's Youth
Identify the different types of graphs and when they are used. Learners will research a specific health issue facing teens today. They then develop a survey, collect and analyze data and present their findings in class. This is a lesson...
Curated OER
Bias in Statistics
Students work to develop surveys and collect data. They display the data using circle graphs, histograms, box and whisker plots, and scatter plots. Students use multimedia tools to develop a visual presentation to display their data.
Curated OER
Questioning NASA
Space science and math collide in this inquiry that investigates launching times for antacid-tablet rockets! Upper elementary or middle school learners collect data as they launch these mini rockets. They apply concepts of place value...
Curated OER
Atlatl Lessons Grades 4-12: Lesson for Beginning Users of Atlatl
Sixth graders determine the mean, range median and mode of a set of numbers and display them. In this data lesson students form a set of data and use computer spreadsheet to display the information. They extend of the process by looking...
EngageNY
Presenting a Summary of a Statistical Project
Based upon the statistics, this is what it means. The last lesson in a series of 22 has pupils present the findings from their statistical projects. The scholars discuss the four-step process used to complete the project of their...
Curated OER
Mean Meadian and Mode
Students apply central tendencies to given data. In this statistics lesson, students calculate the mean, median, and mode as it relates to their data. They collect data and graph it while identifying the way the numbers are ordered.
Curated OER
Student Heights
Students measure the heights of their fellow classmates and create a box and whisker plot to display the data. In this measurement lesson plan, students analyze the data and record results.
Curated OER
Where Do I Want To Live?
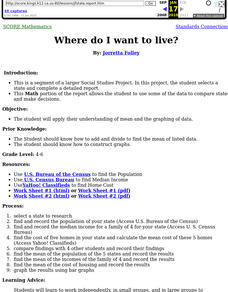
Students use a variety of Internet sources to gather income, population and housing data. Each group bring their results to the class and the class use their findings to compile mean population, income, and housing for all states.
Curated OER
Statistics Newscast in Math Class
Students study sports teams, gather data about the teams, and create a newscast about their data. In this sports analysis lesson, students research two teams and define their statistical data. Students compare the two teams, make...
Curated OER
Graph and Compare the Adventure's Temperature Vs. Local Temperature
Pupils explore the concept graphing data. In this graphing data lesson, students use weather data from their local weather and some other city and graph them. Pupils plot the local weather vs. another city. Students record temperature...
Curated OER
What's the Fizz Factor
Learners as a class create a fountain using both coke soda, and mentos candy. In this science lesson, students test which combination of coke and mentos products produce the tallest fountain. Learners use the scientific method to track...
Curated OER
Tornado!
Students examine the characteristics and types of tornadoes. They discuss how they are formed, conduct an experiment with two liter bottles, analyze data and determine mean and median, and design a house to withstand tornado-force winds
Curated OER
Then and Now
Students conduct research and use census data to compare different times and places. In this census lesson, students interpret data from charts and graphs, comparing census information from two time periods as well as from two different...
Curated OER
Mathematics Module
Delve into graphing! The concepts covered begin with basic graphing basic coordinates and algebraic expressions on coordinate planes, and build up to graphing linear inequalities and equations. Learners solve and simplify various...
Curated OER
Design Team Challenge
Students work in groups to build a robot. In this robotics lesson, students create an electronic robot and program it to follow directions. They create an obstacle course for the robot to follow and test its performance.
Curated OER
Keep it Active
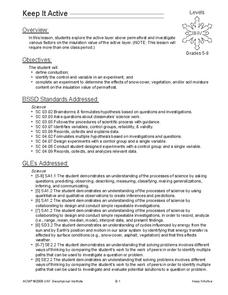
Students explore the active layer above permafrost and investigate various factors on the insulation value of the active layer. In this energy transfer lesson, students conduct and experiment to determine the effects of snow cover,...
Curated OER
Flying High in Math
Seventh graders study how real airplanes fly and then they construct models of paper airplanes using design resources for the Internet and their own design. They use meaurement and caluculations in order to help them construct their...
Curated OER
What I Didn't Know...
Students practice creating wikis. In this wiki lesson, students create a wiki about any math topic that they know nothing about. Students learn about their topic and create a wiki that explains the math topic in detail.


