National Math + Science Initative
Introduction to Decimals
Three activities make up an introductory lesson designed to create a strong foundation in comparing fractions to decimals and exploring and building decimal models. Pupils brainstorm and complete a Venn diagram to show how decimals and...
EngageNY
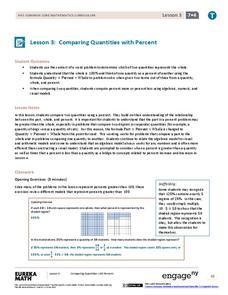
Comparing Quantities with Percent
Be 100 percent confident who has the most and by how much. Pupils use percentages to help make the comparisons by finding what percent one quantity is of the other. They also determine the percent differences between the two...
EngageNY
Part of a Whole as a Percent
Pupils use visual models, numeric methods, and equations to solve percent problems. To complete the second installment of 20, they find the part given the percent and the whole, find the percent given the part and the whole, and find the...
McGraw Hill
Phonics Teachers Resource Book
Looking to improve your classes literacy program? Then look no further. This comprehensive collection of resources includes worksheets and activities covering everything from r-controlled vowels and consonant digraphs, to the...
West Contra Costa Unified School District
The Power of Ten: Building a Magnitude Model
Add visual representation to teaching place value with a magnitude model. Using adding machine tape, pupils build a linear place value strip from 1 to 100.
National Wildlife Federation
Wherefore Art Thou, Albedo?
In the sixth lesson in a series of 21, scholars use NASA data to graph and interpret albedo seasonally and over the course of multiple years. This allows learners to compare albedo trends to changes in sea ice with connections to the...
Making Math More Fun
Making Math More Fun
Address fundamental math skills with a series of fun math board games. With 25 games that focus on addition, subtraction, multiplication, division, place value, and percentages, kids will quickly find that math practice is their favorite...
Science Matters
Earthquake Building/Shaking Contest
Japan is one of only a handful of countries that constructs buildings that are almost earthquake proof. The 13th lesson in the 20-part series challenges scholars to build structures to test against earthquakes. With limited materials and...
Curated OER
Cold War Conflict in Vietnam: The Vietnam-Era Presidency
Comparing and evaluating various media types is a great way to build critical analysis skills. Learners read about the Vietnam era presidency, specifically the foreign policy established by Johnson and Nixon. Then they compare several...
EngageNY
Why Worry About Sampling Variability?
Are the means the same or not? Groups create samples from a bag of numbers and calculate the sample means. Using the sample means as an estimate for the population mean, scholars try to determine whether the difference is real or not.
EngageNY
Summarizing Bivariate Categorical Data with Relative Frequencies
It is hard to determine whether there is a relationship with the categorical data, because the numbers are so different. Working with a familiar two-way table on super powers, the class determines relative frequencies for each...
EngageNY
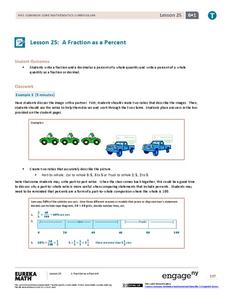
A Fraction as a Percent
It is all about being equivalent. Class members convert between fractions, decimals, and percents. By using visual models, scholars verify their conversions in the 25th portion of a 29-part series.
NEED Project
Calibrating Thermometers
Engage young scientists in the upper-elementary and middle school grades with this collection of simple experiments. Whether you're teaching about heat transfer, density, or potential energy this resource has a lab for you.
Curated OER
Ten More and Ten Less
Get learners to analyze two-digit numbers based on place value, and use manipulatives to add and subtract both 1 and 10. A place value chart is available, and you can project it during guided practice. Through visualizing...

