Fluence Learning
Writing About Literature: Comparing and Contrasting Characters in Heidi
Scholars read excerpts from the story, Heidi, in a three-part assessment that focuses on comparing and contrasting characters. Each part contains three tasks that challenge learners to discuss, answer comprehension...
Curated OER
Compare and Contrast Night to Life is Beautiful
After reading Elie Wiesel's Night, watching the movie Life is Beautiful, and researching World War II, class members write a comparison essay on the book and film. This includes a prior knowledge activity, discussion in whole and small...
K-5 Math Teaching Resources
Venn Diagram Template
Looking to compare and contrast three things? Look no further! Use this Venn diagram template by simply printing and copying as many as you need.
EngageNY
Comparing Linear and Exponential Models Again
Making connections between a function, table, graph, and context is an essential skill in mathematics. Focused on comparing linear and exponential relationships in all these aspects, this resource equips pupils to recognize and interpret...
EngageNY
Describing Distributions Using the Mean and MAD II
The 11th lesson in the series of 22 is similar to the preceding lesson, but requires scholars to compare distributions using the mean and mean absolute deviation. Pupils use the information to make a determination on which data set is...
Fluence Learning
Writing About Literature: Nature in the Writings of John Muir and Emily Dickinson
As an assessment of their skill in crafting a compare and contrast essay, class members read and compare the portrayals of nature in excerpts from naturalist John Muir's My First Summer in the Sierra and from poet Emily Dickinson's...
National Science Teachers Association
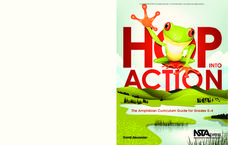
Hop into Action
Young scientists find out what makes amphibians such unique and interesting animals in this simple life science instructional activity. After looking at pictures and discussing the characteristics of amphibians, learners...
Curated OER
Collecting Data to Learn About the People Around You
Human graphs, anyone? Did you eat fruit today? What is your favorite costume? Have your K – 6 learners graph the responses. Early elementary grades may count and compare while upper grades compare responses of different groups or make...
EngageNY
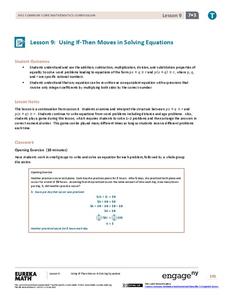
Using If-Then Moves in Solving Equations II
Continuing from the previous lesson in the 28-part series, learners write equations to model problem situations. They then solve the problem by applying the properties of equality. In contrast to the previous lesson, they do not write...
Virginia Department of Education
Growing Patterns and Sequences
Learners explore, discover, compare, and contrast arithmetic and geometric sequences in this collaborative, hands-on activity. They build and analyze growing patterns to distinguish which kind of sequence is represented by a set of data...
Agriculture in the Classroom
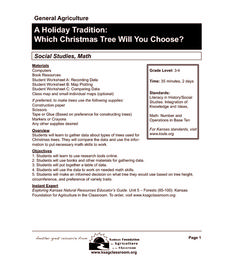
A Holiday Tradition: Which Christmas Tree Will You Choose?
Different varieties of Christmas trees provide an interesting way to combine social studies, science, math, and technology. Class members not only research the history of the Christmas tree holiday tradition, they compare and...
EngageNY
Variability in a Data Distribution
Scholars investigate the spread of associated data sets by comparing the data sets to determine which has a greater variability. Individuals then interpret the mean as the typical value based upon the variability.
Curated OER
Logistic Growth Model, Explicit Version
Via the concrete setting of estimating the population of the US, your algebra learners are introduced to a logistic growth model. Comparing and contrasting logistic, exponential, linear and quadratic models, to see which fits the data...
Partnership for Educating Colorado Students
Mayan Mathematics and Architecture
Take young scholars on a trip through history with this unit on the mathematics and architecture of the Mayan civilization. Starting with a introduction to their base twenty number system and the symbols they used, this eight-lesson unit...
Macmillan Education
Sine and Cosine Graphs
Learners compare and contrast sine and cosine graphs in order to describe their characteristics in a collaborative activity. As they explain their reasoning, learners strengthen their writing and vocabulary skills associated with...
Alabama Learning Exchange
Sky High
How are skyscrapers built? What does it take to make a structurally sound building? How can one work within a budget to complete a building project? These guiding questions will be investigated and answered within a hands-on lesson....
Teach Engineering
Ranking the Rocks for Desired Properties
Math rocks! Cavern design teams determine the rankings of rock types based upon desirability points. The points are connected to the properties of the rocks and their usefulness in building a cavern.
Fluence Learning
Writing About Literature Shakespeare and Plutarch
The Oscar for the Best Adapted Screenplay acknowledges a writer's excellence in adapting material found in another source. What do your class members know about adapted resources? Find out with an assessment that asks readers to...
Fluence Learning
Writing About Informational Text: Political Parties
To demonstrate their ability to craft an analysis of informational text, class members read excerpts from James Madison's "The Federalist No. 10," from George Washington's Farewell Address, and from Thomas Jefferson's First Inaugural...
Novelinks
The Little Prince: Picture Book Strategy
Picture books aren't just for children; they carry strong, valuable messages for adult as well. Explore the audience for Antoine de Saint-Exupéry's The Little Prince with a instructional activity that compares picture books to...
Virginia Department of Education
Box-and-Whisker Plots
The teacher demonstrates how to use a graphing calculator to create box-and-whisker plots and identify critical points. Small groups then create their own plots and analyze them and finish by comparing different sets of data using box...
Virginia Department of Education
Analyzing and Interpreting Statistics
Use measures of variance to compare and analyze data sets. Pupils match histograms of data sets to their respective statistical measures. They then use calculated statistics to further analyze groups of data and use the results to make...
August House
The Pig Who Went Home on Sunday
Turn your classroom into a pig sty with a instructional activity based on the Appalachian folktale The Pig Who Went Home on Sunday. Similar to the story of The Three Little Pigs, the folktale tells a story of four pigs who leave...
Hood River County School District
Text Structure: Features and Organization
Teach learners how to interact with both fiction and non-fiction text with a packet of activities and worksheets. After looking over text structure and the difference in text features between different types of writing,...


