Curated OER
Using Data to Determine the Location of the Stiffest Opposition to School Desegregation in the 1970's
Students analyze historical data. In this school desegregation lesson, students make predictions about opposition to desegregation, examine the provided desegregation data, and determine if their predictions were correct.
Bowland
Speed Cameras
Do speed cameras help reduce accidents? Scholars investigate this question using a series of spreadsheet activities. Along the way, they learn about randomness, probability, and statistical analysis.
EngageNY
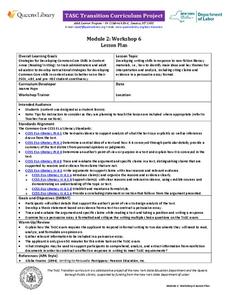
TASC Transition Curriculum: Workshop 6
Is a college education necessary for success in today's world? The class investigates the question, along with others at the end of the sixth workshop in a 15-part series. The lesson has four parts with multiple activities and...
Curated OER
Information at a Glance - Using Tables in Mathematics
Students create table to display GED Testing data located in paragraph provided by teacher, use information in table to create appropriate graph, and determine percentage difference between passing scores and failing scores.
Alabama Learning Exchange
Attitude Determines Altitude
A fabulous instructional activity which combines mathematics with space science. Middle schoolers work in cooperative groups in order to research early astronauts and their accomplishments. They look at a variety of rocket and space...
Curated OER
How High Are the Clouds?
Pupils analyze height and collect data to create a graph. In this statistics lesson, students use central tendencies to analyze their data and make predictions. They apply concept of statistics to other areas of academics to make a...
Curated OER
Make That Shot!
Learners figure out basic percentages by shooting paper balls into a basket, recording results, and calculating individual and team percentages for ten shots.
Curated OER
Biospheres in Your Backyard
Pupils collect data from a local river biome. They use the information for metric conversion and graphing equations. They study the components of what makes up a biosphere and how math is used to analyze one.
Curated OER
Burial Ground
Students visit the burial ground at Huguenot Street and work in groups to calculate the average lifespan for a resident in the 1700's and one in the 1800's. They analyze the grave markers for further information.
Curated OER
Weather for Health
Ninth graders encounter various types of numerical information (represented in multiple ways), much of which is abstract and difficult to comprehend. In this lesson, 9th graders will convert given information into bar graphs. In the...


