Curated OER
Checking Test Comparability/Scattergrams
Students construct a scattergram graph. In this statistics lesson plan, students graph data by hand and using a spreadsheet program. They establish lines of best fit and draw conclusions using their graphs.
Curated OER
My Peanut Butter is Better Than Yours!
Students explore the concept of statistical data. In this statistical data instructional activity, students read an article about the dangers of peanut butter to those who are allergic. Students perform a taste test of two different...
Curated OER
MATH VOCABULARY
Students will produce a 2-3 minute video that will examine, explore and explain one vocabulary word or math concept. Videos will be presented to class and scored on completion, quality and creativity.
Curated OER
The Bell Curve
High schoolers explore the concept of the bell curve. In this bell curve lesson, students discuss the controversy associated with the bell curve. High schoolers use an applet to explore a normal distribution. Students discuss mean,...
Curated OER
Designing Samples/Simple Random Samples
High schoolers explore the concept of sampling techniques. In this sampling techniques lesson, students identify possible sources of bias in situations such as phone polls, supermarket surveys, and drawing names from a phone book. High...
Curated OER
Chaos
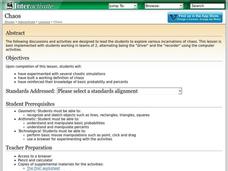
Students explore the concept of probability. In this probability lesson, students use a applet that demonstrates chaos and probability of spread for a forest fire. Students also play applets about the Game of Life and Rabbits and Wolves,...
Curated OER
Phenomenological Probability
Students explore the concept of theoretical and experimental probability. For this theoretical and experimental probability lesson, students roll dice, draw marbles out of a bag, and draw a card from a deck of cards. Students perform...
Curated OER
Are Taxes "Normal?"
Students explore the concept of normal distribution. In this normal distribution lesson, students find the normal distribution of taxes in the 50 US states. Students make histograms, frequency tables, and find the mean and median of tax...
Curated OER
Probability
Students explore the concept of probability. In this probability lesson, students draw golf balls of different colors out of a bag and determine the probability of drawing a particular colored ball. Students make a number wheel with a...
Curated OER
Geometric Designs in the Game of "Life"
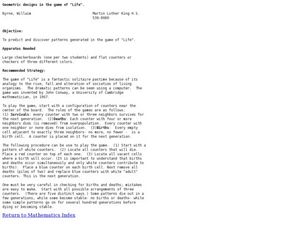
Students play a game to discover simple patterns. In this geometric designs lesson, students use a game board and counters to represent survivals, deaths, and births. They explore simple patterns for several generations.
Curated OER
Fire!, Probability, and Chaos
Young scholars explore the concept of probability. In this probability instructional activity, students simulate a controlled forest burn using an applet. Young scholars vary the probability of trees burning and predict what will happen.
Curated OER
Probability and Sports
Students explore the concept of probability in sports. In this probability in sports lesson, students research a sport that they enjoy. Students find probability information related to their sport. Students share their findings with the...
Curated OER
Questionnaires and Analysis
In this questionnaires and analysis instructional activity, students design a questionnaire and then select a sample. They organize and analyze data. This four-page instructional activity contains 1 multi-step problem. Explanations and...
Curated OER
Estimation and Approximation
In this estimation and approximation activity, students estimate multiplication and division problems containing decimals. They measure given objects, determine the possible error, the lower bound and the upper bound. Students gather...
Curated OER
6 Poisson Distributions
Students explore the concept of poison distributions. In this poison distribution lesson plan, students construct poison distributions by surveying the number of cars that pass a point in a specific amount of time. Students find poison...
Curated OER
Atoms-How Sweet They Are!
In this atoms and sugar molecules worksheet, students are given the structural composition of the sugar molecule maltose. They determine the number of each type of atom in the molecule, they find the ratio of hydrogen to oxygen atoms and...
Curated OER
Statistical Inquiry
In this statistical inquiry instructional activity, students analyze and interpret a variety of diagrams such as a scatter plot, bar graph and pie charts. They create tables and other diagrams to support given data. This two-page...
Curated OER
Data and Probability- What's the Chance?
Young scholars investigate probability through a game. In this data lesson plan, students use dice and predictions to explore how probability works.
Curated OER
Learning to Make Bar Graphs
Students construct bar graphs using the results from various experiments. In this graphing lesson, students review data from a previous experiment and demonstrate how to construct a bar graph. Students use a checklist to ensure...
Curated OER
Probability: Basic Rules of Probability
In this probability worksheet, young scholars determine the probability of independent and dependent events. They complete simple and compound events. This four-page worksheet contains five problems. Answers are provided.
Curated OER
Standard Deviation
In this standard deviation worksheet, students solve and complete 10 different types of problems. First, they determine the number of standard deviations an item was from its mean. Then, students draw a model of what this would look...
Curated OER
Reading Frequency Tables
In this data interpretation worksheet, students record the data from 10 examples into frequency tables. They group 10 more data sets, and make a frequency table for each.
Curated OER
Probability
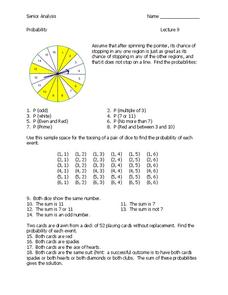
In this probability worksheet, learners solve and complete 32 different problems that include the probability and outcome of various events. First, they use the sample space for tossing a pair of dice to determine the probability of each...
Curated OER
Worksheet 22: Coalitions
In this coalitions worksheet, students identify all minimal coalitions from a given set of material. They give explanations to support their answers. This two-page worksheet contains three multi-step problems.


