Achieve
Ivy Smith Grows Up
Babies grow at an incredible rate! Demonstrate how to model growth using a linear function. Learners build the function from two data points, and then use the function to make predictions.
Curated OER
Polynomials and Linear Factors
This algebra instructional activity reviews writing polynomials in standard form from factored form, looks at the graphs of polynomials of degree higher than two, and identifies the zeros of polynomials using the Factor Theorem and...
Curated OER
Lesson 19: Rational Functions and Long Division
Explore rational functions with this packet. A lot of information is provided, including several examples. Learners graph rational functions and find vertical, horizontal, and oblique asymptotes. This seven-page worksheet contains...
Curated OER
Probability of an event Occurring
In this probability worksheet, 11th graders calculate what the probability of the color of shirt someone is wearing is. There is a solution key with this problem.
Curated OER
e, pi, and Exponential Functions
Students investigate e, pi and exponents. In this calculus lesson, students define constants and non-constants using, pi, e and exponents as an example. They use the TI to work the problems in this lesson.
Kenan Fellows
Half-Life
Scholars shake their way to understanding half-life with the help of candy. They observe and record which side candy lands on to graph the exponential decay in the fifth instructional activity of seven integrating chemistry and algebra....
Radford University
Sleep and Teen Obesity: Is there a Correlation?
Does the number of calories you eat affect the total time you sleep? Young mathematicians tackle this question by collecting their own data and making comparisons between others in the class through building scatter plots and regression...
Virginia Department of Education
Linear Curve of Best Fit
Is foot length to forearm length a linear association? The class collects data of fellow scholars' foot length and the length of their forearms. They plot the data and find a line of best fit. Using that line, they make predictions of...
Curated OER
Mixed Expressions and Complex Fractions
Students are introduced to mixed expressions and complex fractions. They work through several problems with the instructor and then complete a worksheet.
Curated OER
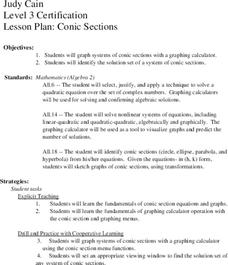
Conic Sections
Students, while using a graphing calculator, graph systems of conic sections as well as identify their solutions. They complete various word problems dealing with conic sections with their calculators. In addition, students sketch graphs...
Curated OER
Relating Distance and Velocity Over Time
Students calculate the distance and velocity over time. For this algebra lesson, students graph a linear function to represent the distance vers time travel. They interpret their graphs and draw conclusion.
Curated OER
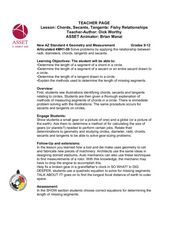
Chors, Secants, Tangents
Pupils identify the relationship between chords, secants and circles. In this geometry lesson, students calculate the length of the chords. They sketch the secant lines on a circle.
Curated OER
Number Properties - Know 'em, Like 'em, Use 'em
Ninth graders express mathematical properties through creation of advertising jingles.
Curated OER
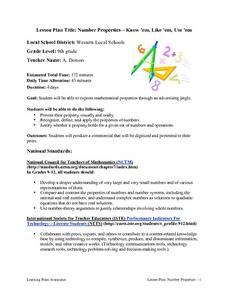
Number Properties-Know'em, Like'em, Use'em
Ninth graders explore mathematical properties through the use of an advertising jingle. They produce a commercial that is digitized and presented to the class. Students write a jingle that simplifies each property and helps classmates...
Curated OER
Slope & Rate of Change
This short handout addresses the concept of slope in two different ways: geometrically and analytically. Start with a brief description of slope, then use graphical representations to compare positive vs. negative slope and zero vs....
Curated OER
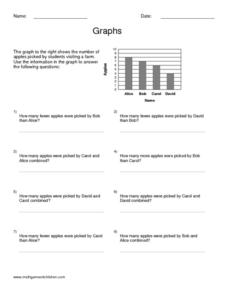
Graphs
For this algebra worksheet, students calculate the point of intersection between a circle and a straight line. There are 5 questions with an answer key.
Curated OER
Square Milk Bottle Crates
Students attempt a problem that Students has the potential to have more than one solution. Hence the problem is accessible to a wide range of students. The problem is essentially about finding patterns and this is typical of a number of...
Curated OER
Conjectures and Conclusions
Learners draw conclusions and make conjectures given a specific scenario. In this geometry lesson plan, students model real life scenarios using properties of triangles. They model number facts and explain why the outcome is what it is.
Curated OER
Means of Growth
Students collect and graph data. In this statistics lesson, students analyze their plotted data using a scatter plot. They identify lines as having positive, negative or no correlation.
Curated OER
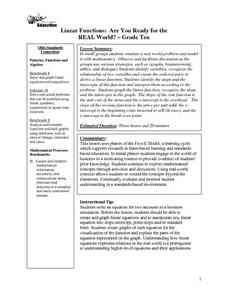
Linear Functions: Are You Ready for the REAL World?
students emulate a real world problem and model it with mathematics working in a small group. Observe and facilitate discussion as the groups use various strategies, such as (graphs, brainstorming, tables, and dialogue.
Curated OER
Functions
Students explore a variety of functions. They recognize and describe functions and use linear functions to describe situations. Students find the domain and range of linear functions and graph rational expressions.


