Curated OER
Descriptive Statistics
Young scholars demonstrate how to use frequency and scatter diagrams. In this statistics lesson, students are introduced to different techniques of representing data. Young scholars sort and graph data on a worksheet and use a frequency...
Project Maths
Outcomes of Coin Tosses
Flip a coin: heads, use the resource; tails, use the resource. The fourth of six installments of the Statistics & Probability unit looks at coin tosses and probability. The class conducts an experiment and sees that the outcomes of...
Curated OER
Starting With Stats
Statisticians analyze a data set of student IQs by finding measures of central tendency and dispersion such as mean, median, mode, and quartiles. They practice using a graphing calculator to find the values and analyze box plots and...
Curated OER
Mathematics: A Picture's Worth a Thousand Words
Students examine school yearbooks from 1950 to the present. They count the number of male and female teachers and administrators. They compile date and extrapolate changes in job trends.
Curated OER
Boxing Up
Middle schoolers explore the relationship between theoretical and experimental probabilities. They use a box model to enter data provided and to randomly draw tickets from the box. Pupils click on any bar in a chart to display the...
Curated OER
What's the Chance?
Students conduct probability experiments with dice and coins. They watch a video for a variety of situations where calculating the probability is complicated by total number of possibilities. They solve problems presented in the video.
Curated OER
Let's Take a Chance!
Students investigate probability and the chance of an even happening. In this algebra activity, students incorporate their knowledge of probability to solve problems and relate it to the real world. They learn to make decisions based on...
Curated OER
Corrupted Politicians
High schoolers solve problems using statistics and probability. In this math lesson plan, students analyze how many corrupted members there are in a fictional town council. They give real life examples where statistics and probability...
Curated OER
Why NP Min?
Students calculate the normal distribution. In this statistics lesson plan, students use the normal distribution to estimate binomial distributions. They define when to use NP and n(1-p) to make approximations.
Curated OER
Remote Possibilities
Students collect data and analyze the data using a graph. In this statistics lesson, students use combinations and theoretical and experimental probability to analyze their data. They observe a remote controlled robot as they collect data.
Curated OER
Assessing Normalcy
Students define normal distribution as it relates to the bell curve. In this statistics lesson, students use the central tendencies of mean, median and mode to solve problems. They plot their data and draw conclusion from the graphs.
Curated OER
What is a P-value?
Young scholars test the hypotheses using p values. In this statistics lesson, students define and examine conditional probability. They test each statement for a true statement or a false statement, based on the sample size.
Curated OER
Gender Issues through Chi-square Experiments
Students investigate teachers and gender preference. In this statistic lesson, students collect data of teachers calling on students to see if they are calling on one gender more than the other. Students examine the data and draw...
Curated OER
Baseball Math
Pupils collect data on baseball plays. In this statistics instructional activity, students graph their data and make predictions based on their observation. They calculate what the probability is that a favorable outcome would happen.
Curated OER
Math in Society
Twelfth graders determine probabilities of real-life events such as life expectancies, winning a lottery ticket and the break-even premium. They apply how life-expectation tables are used to estimate the probability that an individual...
Curated OER
What's in the Bag?
Students calculate the probability of an event occurring. In this statistics lesson, students calculate the outcome using combination and permutation. They differentiate between-theoretical and experimental probability.
Curated OER
Looking Normal
Students identify the shape of a function. In this statistics lesson, students plot the data collected. They analyze their data for positive, negative or no correlation. They find the line of best fit.
Curated OER
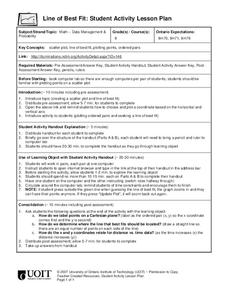
Line of Best Fit
Students identify the line of best fit. In this statistics lesson, students collect and analyze data. They calculate the regression equations and identify the different types of correlation.
Curated OER
Combinations
Students investigate the possibility of different events using combination. In this statistics lesson plan, students investigate the accuracy of permutations and combinations. They solve problems related to combinations.
Curated OER
Means of Growth
Students collect and graph data. In this statistics lesson, students analyze their plotted data using a scatter plot. They identify lines as having positive, negative or no correlation.
Curated OER
Modeling Population Growth
Learners collect data on population growth. In this statistics lesson plan, students graph their data and make predictions. They find the linear regression and the best fit line.
Curated OER
Line of Best Fit
Learners calculate the equation of the line of best fit. In this statistics lesson, students create scatter plots and find the line of best fit going through their data. They make predictions and draw conclusions.
Bowland
Crash Test
Use mathematics and simulations to investigate car crashes. IScholars test hypotheses involving car crashes. They collect, analyze, and display data from computer simulations to support or refute their hypotheses.
Curated OER
The Numbers Tell the Story
Students demonstrate how to gather and interpret statistical data. In this data analysis lesson, students search for statistics on the health effects of smoking and place the information into charts. Students create these charts online...


