West Contra Costa Unified School District
Graphing Linear Inequalities Sort
Learners first determine the slope-intercept and standard forms of inequalities given graphs, and then determine key features of the graphs.
CK-12 Foundation
Single Bar Graphs: Cupcakes
What is a little cake among friends? Given the relationship between the number of cupcakes five friends have, pupils create a bar graph. The learners answer questions about the graph and adjust the graph if one friend shares some of his...
Curated OER
College Prep Algebra, Inequalities
In this algebra worksheet, young scholars solve and graph 10 linear inequalities. Students must remember to alter the inequality when the negative sign is on the variable.
Curated OER
Graphing Systems of Inequalities
Solve equations and graph systems of inequalities. Designed as a lesson to reinforce these concepts, learners revisit shading and boundaries along with solving linear inequalities.
Curated OER
Linear Inequalities in Two Variables
Graph and solve linear equations in two variables. The class relates the concepts of linear equations to the real world.
Curated OER
Linear Inequalities
Through exploration of linear programming through graphs and equations of inequalities, students relate linear programming to real life scenarios, such as business. Graphing and shading is also part of this exercise.
Inside Mathematics
Graphs (2006)
When told to describe a line, do your pupils list its color, length, and which side is high or low? Use a worksheet that engages scholars to properly label line graphs. It then requests two applied reasoning answers.
Corbett Maths
Quadratic Inequalities
Develop a sketchy approach to solving quadratic inequalities! Using a sketch of a graph, the presenter shows a way to solve quadratic inequalities. Pupils then practice that method to solve their own quadratic inequalities and apply the...
Curated OER
Interval Notation and Linear Inequalities
In this interval notation and linear inequalities worksheet, students use number lines and solve equations. Students complete 64 problems total.
Curated OER
Graph It!
There is more than one way to represent data! Learners explore ways to represent data. They examine stacked graphs, histograms, and line plots. They conduct surveys and use stacked graphs, histograms, or line plots to chart the data they...
Curated OER
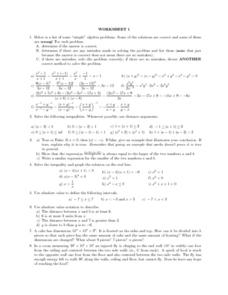
Worksheet 1: Algebra and Inequalities
Challenge your students' algebra skills with this activity, which presents students with several types of problem sets, including solving inequalities, graphing, word problems, and a set of algebra problems that may or may not require...
Curated OER
Solving multi-step inequalities and solving systems by elimination
Students solve multi-step equations and apply the process of elimination. In this algebra lesson, students solve linear inequalities and equations using linear combination and evaluation. They graph their results on a number line and...
Illustrative Mathematics
Telling a Story With Graphs
Turn your algebra learners into meteorologists. Students are given three graphs that contain information about the weather in Santa Rosa, California during the month of February, 2012. Graph one shows temperatures, graph two displays the...
Mathematics Vision Project
Module 2: Systems of Equations and Inequalities
The brother-sister pair Carlos and Clarita need your class's help in developing their new pet sitting business. Through a variety of scenarios and concerns presented to the siblings, the learners thoroughly explore systems of equations...
Mathematics Vision Project
Module 5: Systems of Equations and Inequalities
Systems of equations and inequalities model contextual situations. A set of 12 lessons build a solid understanding of writing and solving systems of equations and inequalities using a variety of methods. The module is the fifth in a...
Shodor Education Foundation
Linear Inequalities
An interactive lesson helps individuals learn to graph inequalities in two variables. Scholars can adjust the interactive to present the inequalities in standard or slope-intercept form.
EngageNY
Finding Systems of Inequalities That Describe Triangular and Rectangular Regions
How do you build a polygon from an inequality? An engaging instructional activity challenges pupils to do just that. Building from the previous instructional activity in this series, learners write systems of inequalities to model...
Project Maths
Inequalities
Which number is bigger? Using a variety of activity sheets, this unit starts with the basics of inequalities and progresses through solving compound linear inequalities. Problems cover the range of inequalities including inequality word...
Balanced Assessment
Multi-Graphs
So many things change as time goes by. Here, scholars create graphs based on this premise. Each problem asks pupils to sketch a graph that describes a given situation. Their graphs represent various characteristics such as height,...
West Contra Costa Unified School District
Connecting Graphing and Solving Absolute Value Equations and Functions
Can you solve an equation graphically? Absolutely! This Algebra II lesson makes the connection between solving an absolute value equation and graphing two functions. Graphing absolute value functions is presented through the process of...
Balanced Assessment
Toilet Graph
Mathematics can model just about anything—so why not simulate the height of water in a toilet bowl? The lesson asks pupils to create a graphical model to describe the relationship of the height of the water as it empties and fills again....
Curated OER
Compound Inequalities
In this algebra learning exercise, 11th graders solve compound inequalities and graph their solution on a number line. There are 6 questions with an answer key.
Curated OER
Compound Inequalities
In this algebra worksheet, students solve compound inequalities and graph their answer on a number line. There are 18 questions with an answer key.
Curated OER
Graphing Linear Equations and Inequalities
Students discuss methods to solve equations and inequalities with one variable. As a review, they write Addition and Subtraction properties of equality and Multiplication and Division properties of equality. Students graph points, write...
Other popular searches
- Graphing Linear Inequalities
- Graphing Inequalities
- Math Graphing Inequalities
- Graphing Compound Inequalities
- Algebra Graphing Inequalities


