Charleston School District
Pre-Test Unit 7: Real Numbers
Don't be irrational! Use this pre-test to assess your classes' ability to work with all types of real numbers. The lesson asks learners to estimate value, evaluate roots, and order numbers. This begins a series of lessons on the real...
Illustrative Mathematics
Comparing Rational and Irrational Number
Algebra learners must know how to use rational numbers to approximate irrationals. This resource asks participants to decide which number is larger without using a calculator. It makes a great exercise to use as a five-minute transition...
Pennsylvania Department of Education
Adding and Subtracting Rational Numbers to Solve Problems
Students explore the concept of probability. In this probability lesson, students use area to determine probability. Students use charts and spinners to help determine the probability of events such as flipping a coin or rolling a...
Curated OER
Speeding By The Numbers
Students determine speed by running or walking a given distance and dividing the distance by the time it took them to do so. They record their average speed and compare it with the speeds of other moving objects.
Mathematics Vision Project
Module 3: Polynomial Functions
An informative module highlights eight polynomial concepts. Learners work with polynomial functions, expressions, and equations through graphing, simplifying, and solving.
Bowland
Mobile Phones
Cheaper cell phone bills? Learners compare two different cell phone plans for a specified number of minutes of phone usage each day. They also determine the conditions for which one plan is cheaper than the other.
Curated OER
Integers
Young scholars graph integers on a number line. In this integers lesson, students create a colored foldable to assist them with notetaking and problem solving. Young scholars complete exercises from text.
Curated OER
A Fraction of the Possibilities
Learners review the conversion of fractions to decimals, develop strategies to compare fractions perform complex calculations using ratio techniques similar to the construction of fractions.
Curated OER
Linear Equations
In this algebra activity, students solve linear equations and graph their answer. They add and subtract integers and compare them using a number line. There are 15 questions with an answer key.
Curated OER
Get In Line!
High schoolers compare and order fractions and decimals using a number line. They use rules of conversion to determine equivalencies competing problems accurately and plot points on the number line that represent the correct order of the...
Curated OER
Which Bag is Which?
Students explore number sense by completing a statistical analysis game in class. In this data graphing lesson, students utilize visual references such as colored cubes and tiles to map out the results of an experiment outcome such as a...
Curated OER
Handling Data- Health Statistics
In this social studies worksheet, students organize 50 country cards into groups. Students analyze a chart and group countries according to lowest, middle, and highest Infant Mortality Rate.
Curated OER
STRETCHING SPRING
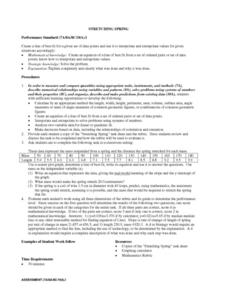
Young scholars calculate the length, width, height, perimeter, area, volume, surface area, angle measures or sums of angle measures of common geometric figures. They create an equation of a line of best fit from a set of ordered...
Curated OER
Pi Digit Distribution
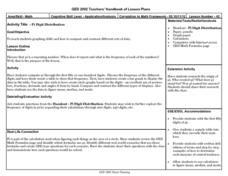
Learners study graphing skills and compare and contrast data sets. They compute pi through the first 50-100 digits and create a bar graph showing the frequencies of specific digits.
Curated OER
What percent of ratio is proportion?
Ninth graders investigate the concepts of ratio and proportion.They solve examples with the teacher for ratios and proportions. A basic fraction review is used for a warm up in this lesson. The primary focus of the lesson appears to be...
Curated OER
Astronomical Scales
Students describe the different units of measurement. In this space science lesson, students calculate astronomical distances using a scale. They explain the significance of using scientific notation in expressing very small or very...
Curated OER
Lesson #46: Bar Graphs and Line Graphs
In this bar graphs and line graphs worksheet, students interpret bar graphs, line graphs, and box-and-whisker plots. They find the measures of central tendency. This three-page worksheet contains notes, vocabulary, and approximately 10...
Curated OER
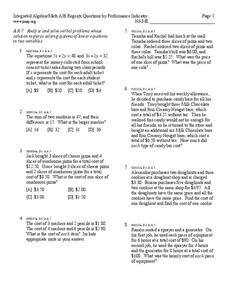
Systems of Equations - Week 6
For this systems of equations worksheet, students solve systems of equations simultaneously. They read story problems, write systems of equations. This two-page worksheet contains eight problems.


