Curated OER
Tables, Charts and Graphs
Students examine a science journal to develop an understanding of graphs in science. In this data analysis lesson, students read an article from the Natural Inquirer and discuss the meaning of the included graph. Students create a...
West Contra Costa Unified School District
Quadratic Equations — What We Know
Everything you could possibly want to know about quadratic equations, all in one resource. Instructors demonstrate how to translate between different forms of quadratics (equation, table of values, graph, verbal description) and finding...
West Contra Costa Unified School District
Multiple Representations of Equations
class members first work through finding the equation, table of values, graph, and key features of a linear function expressed verbally. Individuals then work through several more problems given different representations.
Curated OER
Walk-A-Thon
Students graph linear http://www.lessonplanet.com/review?id=180542equations. In this problem solving lesson, students calculate slope and plot ordered pairs on a coordinate grid. Using a real-life example of a walk-a-thon, students...
Yummy Math
US Holiday Candy Sales
Candy is a big business! Calculate the amount of money consumers spent on major holidays—Easter, Halloween, Christmas, Hanukkah, and Valentine's Day—based on the total amount of candy sales from 2011 and the percentage of each holiday's...
Curated OER
Using Data Analysis to Review Linear Functions
Using either data provided or data that has been collected, young mathematicians graph linear functions to best fit their scatterplot. They also analyze their data and make predicitons based on the data. This lesson is intended as a...
Curated OER
Reading Graphs
Students read graphs and charts to interpret results. In this algebra instructional activity, students interpret bar, line and pictographs. They draw conclusions and make predicitons based on these charts.
Mathematics Vision Project
Module 2: Systems of Equations and Inequalities
The brother-sister pair Carlos and Clarita need your class's help in developing their new pet sitting business. Through a variety of scenarios and concerns presented to the siblings, the learners thoroughly explore systems of equations...
Curated OER
Data Collection and Presentation
Middle and high schoolers collect and analyze data from four different activities. The activities include information about classmates, tallying colors of cars in a parking lot, stem and leaf plots, and making a histogram from winning...
Virginia Department of Education
Functions 1
Scholars learn what it means for a relation to be a function and see various representations of functions. After learning the definition, they participate in a card sorting activity classifying relations as functions or not.
Curated OER
Organizing and Interpreting Data
In this organizing and interpreting data worksheet, students solve and complete 10 different problems related to reading various data tables. First, they complete the 3 charts shown with the correct tally amount, frequency amount, and...
Achieve
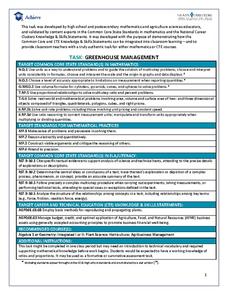
Greenhouse Management
Who knew running a greenhouse required so much math? Amaze future mathematicians and farmers with the amount of unit conversions, ratio and proportional reasoning, and geometric applications involved by having them complete the...
Curated OER
Linear Patterns in Data
Eighth graders extend their learning of graphing linear equations and are introduced to connecting patterns in tables and graphs to represent algebraic representations. They then determine patterns and extrapolate information from these...
Curated OER
Choosing a Summer Job
What did you do over your summer vacation. Young wage earners must compare summer job options, and determine when each job earn the same amount and what that amount be. This be done by creating, graphing, and solving systems of...
Curated OER
VARIABLES AND PATTERNS, USE AFTER INVESTIGATION THREE. DISCRETE OR CONTINUOUS LINEAR RELATIONS.
Students discover for which kind of linear function is appropriate to use the "scatter" or the "connected" term. In this lesson, students investigate functions using variables, patterns book, graph paper, rulers and the graphit program.
Curated OER
Jumping in the Air - What was your Height?
Students solve equations using the quadratic formula. In this quadratic equations lesson, students use digital cameras to film students jumping and import film clips into a computer. Students use the data in the quadratic formula...
Curated OER
Linking Real World Data to the Classroom
Students analyze data representing real life scenarios.In this algebra lesson, students collect, plot and analyze data using a graph. They use different methods to represent and present their data.
Curated OER
Linear Functions
Students solve and graph linear equations. In this algebra instructional activity, students collect data and plot it to create a linear function. They identify the domain and range of each line.
Curated OER
How Sharp Is Your Memory?
Students play a memory game as they explore reasoning. In this algebra lesson, students identify concepts using pictures and words. They model real life scenarios using hands on manipulatives.
Texas Instruments
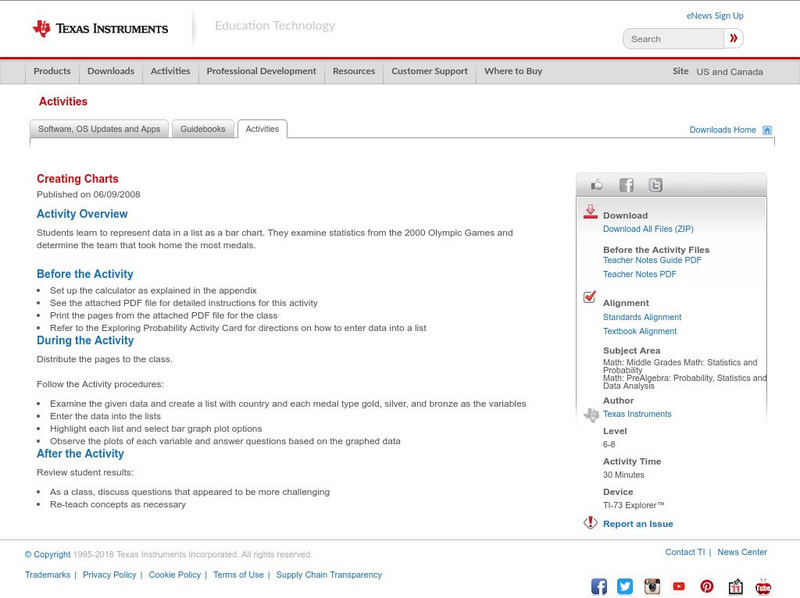
Texas Instruments: Creating Charts
Students learn to represent data in a list as a bar chart. They examine statistics from the 2000 Olympic Games and determine the team that took home the most medals.
Other popular searches
- Charts Graphs and Tables
- Tables, Graphs, Charts
- Graphs Charts Tables
- Maps, Charts, Graphs, Tables
- Charts, Tables, Graphs
- Charts, Graphs and Tables


