Pennsylvania Department of Education
Analyzing Numeric and Geometric Patterns of Paper Pool
Learners use concrete and pictorial representation of geometric patterns to extend patterns. In this geometric patterns lesson plan, students identify patterns and extend them.
Curated OER
Walking on Air
Students collect and analyze data with a graph. In this statistics lesson, students use central tendencies to find the meaning of their data. They display the data on a Ti calculator.
Curated OER
The Swinging Pendulum
Students observe a pendulum and graph their observation. In this algebra lesson, students use the TI calcualtor to graph the motion the pendulum makes. They analyze the graph and make predictions.
Curated OER
Optimization For Breakfast
Students identify he proportion of a cereal box. In this algebra lesson, students define the relationship between patterns, functions and relations. They model their understanding using the cereal box.
Curated OER
Recognizing Patterns
Middle schoolers explore the concept of patterns. In this patterns lesson, students use applets to manipulate tessellations. Middle schoolers predict the next number in a sequence by recognizing patterns.
Curated OER
Hot Wheels
Students observe the action produced by toy cars. In this geometry lesson, students discuss motion and distance as they relate to the movement of a spherical object.They collect data and make conjectures based on their data.
Curated OER
Introduction to Polynomials
Students analyze the graphs of polynomial functions, examine vocabulary associated with polynomials, and determine the maximum number of real roots possible for a polynomial
Curated OER
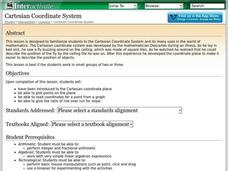
Cartesian Coordinate System
Students explore the concept of the coordinate plane. In this coordinate plane instructional activity, students graph points on the coordinate plane using an applet. Students graph functions using an applet. Students play a Maze Game...
Curated OER
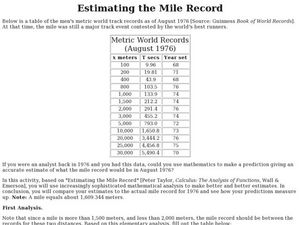
Estimating the Mile Record
In this estimating the mile record, students examine given data. They use create a box-and-whisker plot to determine the upper and lower quartiles of the data. This one-page worksheet contains 1 multi-step problems.
Curated OER
What are the Odds
Students predict the-outcome of an event. In this algebra lesson, students compare and contrast the probability of an event occurring. They calculate the odds of a simple event and make estimation.
Curated OER
La Toteca- A Tropical Paradise
Students collect data on the time of the ferry. For this algebra lesson, students use the data to predict a ferry schedule. They also compute the depth where oxygen would be needed when diving.
Curated OER
Viewing Tubes
Middle schoolers complete a lab in order to discover if the length of a viewing tube, its diameter, or the distance from an object affect the type of data collected and the resulting graph.
Curated OER
The X-33 and the X-38
Students explore the relationships among the lengths, areas, and volumes of similar solids. They also discover what effect doubling the dimensions of a figure has on the resulting area.
Curated OER
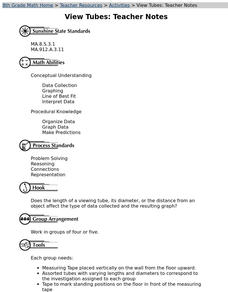
View Tubes
Eighth graders decide if the length of a viewing tube, its diameter, or the distance from an object affects the type of data collected and the resulting graph through a series of experiments.
Curated OER
Perimeters, Patterns, and Conjectures
Students discover patterns and write conjectures relating to perimeters and polygons. Working in cooperative learning groups, they use manipulatives and graphic organizers to solve problems then answer a series of questions in which they...
Curated OER
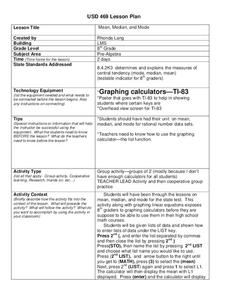
Mean, Median, and Mode
Eighth graders practice using the LIST key on graphing calculators using the proper syntax. They work with the functions of mean, median, and mode in a teacher led lesson and then with a partner on a second data set. They follow...
Curated OER
Students Analyze Data With Scatter Plots
Scatter plot lessons can help students create different types of graphs by hand or with the aid of technology.


