Curated OER
Water Down the Drain
Did you know that leaky faucets waste $10 million worth of water? Conservationists perform an experiment and draw best-fit lines to explore how the US Geological Society determined this value.
Curated OER
Interpreting and Displaying Sets of Data
Students explore the concept of interpreting data. In this interpreting data lesson, students make a line plot of themselves according to the number of cubes they can hold in their hand. Students create their own data to graph and...
Shodor Education Foundation
Graphing and the Coordinate Plane
Ready to introduce your class to the coordinate plane? This website includes a detailed lesson plan that includes two interactive games to help learners practice graphing ordered pairs. The scripted discussion is a little cheesy and a...
Curated OER
Interactivate - Lines, Rays, Line Segments, and Planes
Students explore lines, rays, line segments, and planes. In this math lesson, students discuss the math concepts and direct their instructor in graphing functions. Students collaborate in graphing additional functions.
Curated OER
Building A Nation
Students build their own nation in groups where they create a name, flag, declaration of independence, form of government, mathematical layout, and more. In this nation lesson plan, students also provide a scale drawing of their nation...
Curated OER
Students Analyze Data With Scatter Plots
Scatter plot lessons can help students create different types of graphs by hand or with the aid of technology.
Curated OER
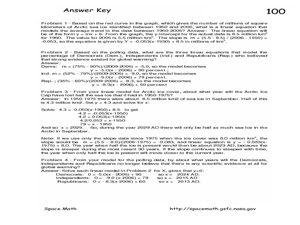
The Global Warming Debate and the Arctic Ice Cap
In this global warming and the Arctic ice cap worksheet, students use two graphs showing data about the amount of Arctic sea ice between 1950 and 2006 and the percent of people surveyed that believe the Earth has gotten warmer over the...
Curated OER
Candy Land
In this activity students pretend that they have been hired by a candy manufacturer to design a box for a new product they are beginning to market. The manufacturer has pre-determined the volume of the candy box. It is the students' job...
Curated OER
Rational Numbers
Young scholars investigate rational numbers in this algebra lesson. They graph systems of equations and use technology to find the point of intersection. They need a TI for this assignment.
Curated OER
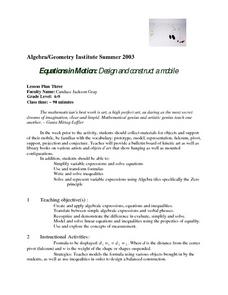
Equations in Motion: Design and construct a mobile
Students participate in a lesson that covers the concepts of solving equations and inequalities. To master the concept they must demonstrate visually and verbally how both sides of an equation must be balanced. They construct a balanced...
Curated OER
Algebra: Mirror, Mirror on the Universe
Students assess how algebra, telescopes, space exploration and optics are so important in astronomy. They encounter studies on the Hubble Space Telescope, Hubble Deep Field and how algebra helps to determine the effects of contamination...
Curated OER
The X-33 and the X-38
Students explore the relationships among the lengths, areas, and volumes of similar solids. They also discover what effect doubling the dimensions of a figure has on the resulting area.
Curated OER
Reading Graphs
Students practice plotting functions on the Cartesian coordinate plane, see several categories of functions, including lines and parabolas, and read a graph, answering questions about the situation described by the graph
Curated OER
Reading Graphs
Students plot functions on the Cartesian coordinate plane. They explore lines and parabolas. Students analyze graphs and answer questions about the information presented on the graph using an online program.
Curated OER
What Are The Chances
Students calculate the probability of an event occurring. In this probability instructional activity, students differentiate between independent, dependent or compound events. They find the range of the data.
Curated OER
The Quadratic Formula
Students solve quadratic function by completing the square. In this algebra lesson plan, students use the quadratic formula to factor quadratics and find the roots. They graph the parabola and identify its properties.
Pennsylvania Department of Education
Analyzing Numeric and Geometric Patterns of Paper Pool
Learners use concrete and pictorial representation of geometric patterns to extend patterns. In this geometric patterns lesson plan, students identify patterns and extend them.
Curated OER
Graphing System of Equations
Students solve system of equation. In this algebra lesson, students graph, substitute and eliminate to solve system of equation. They identify the point of intersection and how many solution each system will have.
Curated OER
Walking on Air
Students collect and analyze data with a graph. In this statistics instructional activity, students use central tendencies to find the meaning of their data. They display the data on a Ti calculator.
Alabama Learning Exchange
The State Capital of Stem and Leaf
Students explore the concept of stem and leaf plots. For this stem and leaf plots lesson, students plot the 50 US states' capitals on a stem and leaf plot according to the first letter of each state. Students compare their stem and...
Curated OER
The Swinging Pendulum
Students observe a pendulum and graph their observation. In this algebra lesson, students use the TI calcualtor to graph the motion the pendulum makes. They analyze the graph and make predictions.
Curated OER
Graphing and the Coordinate Plane
Young scholars gain practice reading coordinates and plotting points by participating in the Coordinates! Game. They demonstrate and test their skills with graph paper and the Maze Game.
Curated OER
Optimization For Breakfast
Students identify he proportion of a cereal box. In this algebra lesson, students define the relationship between patterns, functions and relations. They model their understanding using the cereal box.
Curated OER
Recognizing Patterns
Learners explore the concept of patterns. In this patterns lesson, students use applets to manipulate tessellations. Learners predict the next number in a sequence by recognizing patterns.
Other popular searches
- Linear Measurement Grade 3
- Convert Linear Measurement
- Grade One Linear Measurement
- Linear Measurement Unit Plan
- Math Linear Measurement
- Linear Measurement Lessons
- Technical Linear Measurement
- Math Linear Measurement
- Metric Linear Measurements
- Adding Linear Measurements
- Measurement Customary Linear
- Linear Measurement Metric


