Curated OER
Hybrid Vehicles: Cut Pollution and Save Money
Students examine how driving a hybrid car can save money and cut down on pollution. In this hybrid vehicles lesson students complete an exercise that shows them how to work with proportions, percents, dimensional analysis and linear...
Curated OER
Let's Go Slopey
Young scholars create a table of values to graph a line. In this algebra lesson, students identify the slope and intercept of a linear equation. They use a Ticalculator to graph their function.
Curated OER
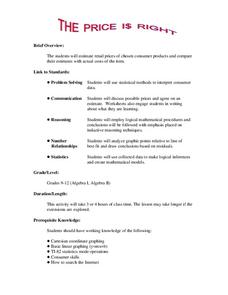
The Price Is Right
Students create a list of products with estimated prices. In this algebra lesson plan, students learn to write equations using variables. They match their created list with that of actual products and compare their prices,
Curated OER
What's Its Slope
Learners identify the slope of a lines.For this algebra lesson, students define the meaning of slope and write an equation given the slope. They graph linear functions using the slope and y-intercept.
Curated OER
Geometric Coordinates
In this geometric coordinates worksheet, students solve and complete 3 different types of problems. First, they use the equations provided to complete the table on the right. Then, students plot the x- and y- coordinates on the graph to...
Curated OER
Walking Home
Learners discover the formulas for calculating distance. In groups, they solve equations determine the distance in a specific amount of time. They record their answers in a chart or graph and compare them with their classmates.
Curated OER
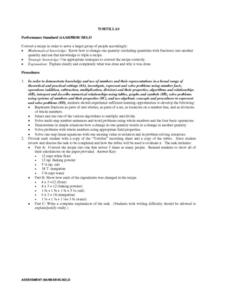
Tortillas
Students convert recipes for tortillas. They calculate the amounts of ingredients as they convert recipes and write an explanation of the task to demonstrate their calculations. After reviewing their calculations, they demonstrate how...
Curated OER
Ratios and Proportions
This study guide would be great to use when presenting a lesson on ratios and proportions. It includes clear definitions, explanations, and examples to work through as a class or individually. In addition, it has notes on rates and...
Curated OER
Solving Multi-Step Inequalities
Ready to study inequalities with your class? Use this worksheet to solve multi-step inequalities and graph the solutions. The document would be great to use as a study guide as you present the material, or could easily be modified and...
Curated OER
Slope & Rate of Change
This short handout addresses the concept of slope in two different ways: geometrically and analytically. Start with a brief description of slope, then use graphical representations to compare positive vs. negative slope and zero vs....
Curated OER
The Way to Better Grades!
Pupils collect and analyze data. In this statistics lesson, learners create a scatter plot from their collected data. They use, tables and graphs to analyze the data and mae decisions.
Curated OER
Interactivate - Lines, Rays, Line Segments, and Planes
Young scholars explore lines, rays, line segments, and planes. For this math lesson, students discuss the math concepts and direct their instructor in graphing functions. Young scholars collaborate in graphing additional functions.
Curated OER
Graphing and the Coordinate Plane
Students examine the four quadrants of Cartesian coordinate plane. They play maze games and coordinate games to discover how to read and plot points on the plane. Students plot points on the coordinate plane and examine the ratio of...
Curated OER
Mine Shaft Grade 8 Slope
Eighth graders investigate slopes using real life scenario. For this algebra lesson, 8th graders model and interpret real life data. They plot their data in a coordinate plane and discuss the results with the class.
Curated OER
Building A Nation
Students build their own nation in groups where they create a name, flag, declaration of independence, form of government, mathematical layout, and more. In this nation lesson plan, students also provide a scale drawing of their nation...
Curated OER
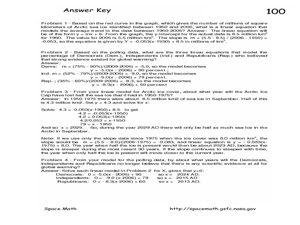
The Global Warming Debate and the Arctic Ice Cap
In this global warming and the Arctic ice cap worksheet, students use two graphs showing data about the amount of Arctic sea ice between 1950 and 2006 and the percent of people surveyed that believe the Earth has gotten warmer over the...
Curated OER
Correlation of Variables by Graphing
Middle and high schoolers use a spreadsheet to graph data. In this graphing lesson plan, learners determine how two parameters are correlated. They create a scatter plot graph using a computer spreadsheet.
American Statistical Association
Scatter It! (Predict Billy’s Height)
How do doctors predict a child's future height? Scholars use one case study to determine the height of a child two years into the future. They graph the given data, determine the line of best fit, and use that to estimate the height in...
American Statistical Association
You and Michael
Investigate the relationship between height and arm span. Young statisticians measure the heights and arm spans of each class member and create a scatter plot using the data. They draw a line of best fit and use its slope to explain the...
Inside Mathematics
Scatter Diagram
It is positive that how one performs on the first test relates to their performance on the second test. The three-question assessment has class members read and analyze a scatter plot of test scores. They must determine whether...
Happy Maau Studios
Math Ref
Forgot how to multiply matrices? Well, this app can help. It is like a gigantic, well-organized reference card for all things math. Customize your personal reference material by adding your own notes and build up a personalized list of...
Illustrative Mathematics
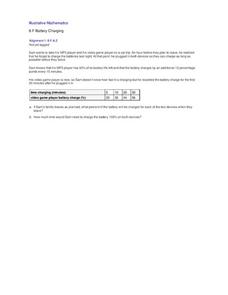
Battery Charging
Your class will be very interested in the results of this activity. How long does it take a MP3 and video game player to charge? Sam only has an hour and the MP3 player only has 40% of its battery life left. Plus, his video player is...
Curated OER
Birds' Eggs
More than just data, scatter plots are full of information that can be used to answer a variety of questions. This lesson uses a plot with information about bird egg sizes to answer questions about the relationship between length and...
Other popular searches
- Graphing Linear Equations
- Solving Linear Equations
- Systems of Linear Equations
- Writing Linear Equations
- Graphing Lines
- Algebra Linear Equations
- Linear Equations and Graphs
- System of Linear Equations
- Two Step Linear Equations
- Linear Equations Data
- Nonlinear Equations
- Slope of Linear Equations


