Charleston School District
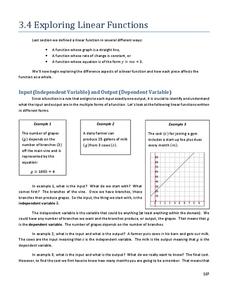
Exploring Linear Functions
What does a graph or equation say about a situation? Lots! The lesson uses the concepts explored in the previous four lessons in the series and applies them to problem solving situations. Learners create an equation from problems posed...
Charleston School District
Graphs of Linear Functions
What does a slope of 2/3 mean? Develop an understanding of the key features of a linear function. Pupils graph the linear functions and explain the meaning of the slope and intercepts of the graphs.
EngageNY
Using Linear Models in a Data Context
Practice using linear models to answer a question of interest. The 12th installment of a 16-part module combines many of the skills from previous lessons. It has scholars draw scatter plots and trend lines, develop linear models, and...
Charleston School District
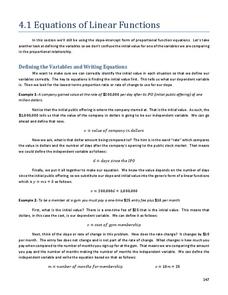
Equations of Linear Functions
Teaching linear function relationships using contextual information is beneficial to pupils' understanding. The lesson uses problem solving to build linear functions given different information for each problem. This is the second in a...
Charleston School District
Intro to Functions
How are functions related to chicken nuggets? A video teaches the concept of a function using the idea of a nugget-making machine as an analogy for a function machine. Learners determine if a relation is a function from an equation and a...
Curated OER
MP3 Purchase Plans
Use algebra to solve real world problems. Mathematicians practice use of graphs, tables, and linear functions to solve a problem regarding mp3 purchase plans. They work in groups to solve the problem and present their findings and...
Illustrative Mathematics
High School Graduation
An exercise in finding the approximate time that a name would be called at a graduation. Estimating time may be difficult for some of the class, so this resource would not be a good choice for learning this standard. It does end with a...
Curated OER
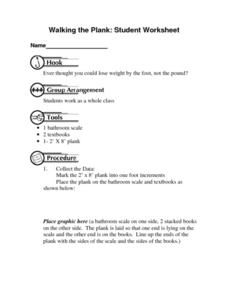
Walking the Plank: Student Worksheet
For this math worksheet, students will work in a group to experiment with the weight of objects when placed at a distance from a scale (using a plank). Students will record and graph their results.
Curated OER
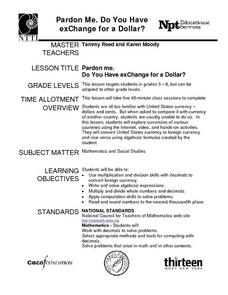
Pardon Me. Do You Have Change For a Dollar?
Upper elementary and middle school learners explore currencies from a variety of countries. They use the Internet, video, and engage in hands-on activities. They practice converting U.S. currency to foreign currency and vice versa. This...
EngageNY
Graphs of Functions and Equations
Explore the graphs of functions and equations with a resource that teaches scholars how to graph functions as a set of input-output points. They learn how the graph of a function is the graph of its associated equation.
Curated OER
Altering a Plant Environment
Students investigate what a controlled group is by creating an experiment. In this plant growth lesson, students identify the different parts of a plant and discuss what is needed for a plant to be successfully grown. Students grow a...
Curated OER
Spaghetti Bridges
Students thread a piece of spaghetti through the holes in the cup. One person suspend the cup by placing each index finger approximately one inch in from the ends of the spaghetti.
Curated OER
Spaghetti Bridges
Eighth graders experiment with building bridges of spaghetti, pennies, and a cup to determine how varying the number of spagetti pieces affects the strength of the bridge. They graph their results and interpret the data.
Curated OER
Choosing a Summer Job
What did you do over your summer vacation. Young wage earners must compare summer job options, and determine when each job earn the same amount and what that amount be. This be done by creating, graphing, and solving systems of...
Curated OER
From Playing with Electronics to Data Analysis
Learners collect and Analyze data. In this statistics lesson plan, students identify the line of best fit of the graph. They classify lines as having positive, negative and no correlation.
Curated OER
Saving the Bald Eagle
Students plot on a coordinate plane. In this algebra lesson, students identify points on a coordinate plane and graph lines given coordinate pairs. They create a model as they study bald eagles and their growth and decay.
Curated OER
Building a Rover
Students investigate properties of lines and points by making a rover. For this algebra lesson, students plot points correctly on a coordinate plane. They identify coordinate pairs given the plots and lines.
Curated OER
Algebra I - Test
Students participate in a lesson that reviews the concept of linear functions in connection with preparation for an exam. The teacher reviews problems with the students for scaffolding. Students practice graphing linear functions.
Curated OER
Buying a Car
Eighth graders create spreadsheets to calculate payments. They create a list of items they would like to purchase that require monthly payments. They simulate buying a car and create a spreadsheet to determine the amount of the monthly...
Curated OER
Is there Treasure in Trash?
More people, more garbage! Young environmentalists graph population growth against the amount of garbage generated per year and find a linear model that best fits the data. This is an older resource that could benefit from more recent...
Curated OER
Drug Sales Soar - Rate of Change
In this prescription drug worksheet, students answer short answer questions and create graphs on the sales of prescription drugs over a five year span. Students complete six questions.
Curated OER
Introduction to Functions
Students explore functions, function rules, and data tables. They explore terms of linear functions. Students use computers to analyze the functions. Students write short sentences to explain data tables and simple algebraic expressions.
Curated OER
Recognize, create and Record Simple Repeating Patterns
Young scholars analyze, create, and record repeating patterns. In this geometry lesson, students create shapes using patterns and keep track of the different shapes. They incorporate transformation and reflections into their patterns.
Curated OER
Calculator-Based Lessons Help Examine Real-World Data
Students may determine equations based on graphs and regression models.


