Curated OER
Linear Equations Data Tables
Students graph linear equations on a Cartesian plane. After describing data tables and their use, students explore how the information from a table can be used to create a line graph. They discuss reasons for plotting a minimum of...
Curated OER
Acceptance Sampling
In this algebra lesson, students sample food and identify acceptance sampling. They create specific plans to meet specific situations as they sample the food. There are 6 questions.
Curated OER
Inequalities and Their Graphs
In this algebra activity, learners identify the solution of an inequality. They graph their answers on a number line. There is an answer key to this problem.
Curated OER
Triangle Exterior Angles Theorem
Learners identify the measure of missing exterior angles. In this geometry lesson,students define and apply the exterior angle theorem to solve problems. They use Cabri software to create different angles and make investigations.
Curated OER
Whose Line is it Anyway?
Students solve systems of equations. In this algebra lesson, students identify the domain and range of each function. They use the slope and y-intercept to graph each line.
Curated OER
In Debt or Not In Debt
Students investigate the use of credit cards. In this algebra lesson, students differentiate the interest rate of credit cards and how to stay debt free. They identify pros and cons of credit cards.
Curated OER
Linear Functions
Students solve and graph linear equations. In this algebra lesson, students collect data and plot it to create a linear function. They identify the domain and range of each line.
Curated OER
Expressions and Operations
In this expressions and operations worksheet, students solve and complete 5 different problems that include identifying expressions and using the order of operations. First, they determine the value of a given expression and its...
Curated OER
Introduction to Graphical Representation of Data Sets in Connection to Cellular Growth
Young scholars practice graphing relationships between variables by studying topics such as exponential growth and decay. They conduct a series of numerical experiments using a computer model and a variety of physical experiments using...
Curated OER
Like Terms
Students examine various algebraic terms. They simulate the addition of like terms and adding and subtracting coefficients by acting out the variables.
Curated OER
Points in the Complex Plane -- Lab
Students review the lecture portion of this activity. Individually, they graph various points on a complex plane and identify conjugates based on their location on the graphs. They complete a worksheet and review their answers to end the...
Curated OER
Ice Creams
Students list all the outcomes for single events, and for two successive events in a systematic way. When dealing with a combination of two experiments, they identify all the outcomes, using diagrammatic, tabular or other forms of...
Curated OER
Chaos and Fractal Applications
Eighth graders identify the different applications of fractals. In this math lesson, 8th graders use graphing calculator to solve algorithms. They explain how changing parameters and initial conditions affect the solutions.
Curated OER
Changes in Force, Motion, and Energy
Eighth graders construct various machines and compare the work done by them.
EngageNY
Using Linear Models in a Data Context
Practice using linear models to answer a question of interest. The 12th installment of a 16-part module combines many of the skills from previous lessons. It has scholars draw scatter plots and trend lines, develop linear models, and...
Alabama Learning Exchange
Human Slope
Middle and high schoolers explore the concept of slope. In this slope lesson, learners graph lines using a life-size graph. They use chalk on a blacktop to create a coordinate plane and use each other as the tick marks on the grid....
Charleston School District
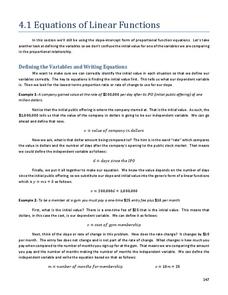
Equations of Linear Functions
Teaching linear function relationships using contextual information is beneficial to pupils' understanding. The lesson uses problem solving to build linear functions given different information for each problem. This is the second in a...
Curated OER
Data Squares
Middle and high schoolers examine how data squares organize and sort information and data sets. They discuss examples of data squares, complete a data square about themselves, organize the data squares for the class together, and compile...
Charleston School District
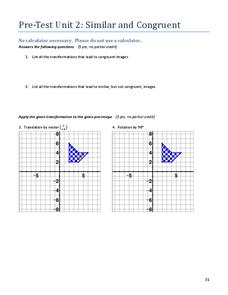
Pre-Test Unit 2: Similar and Congruent
A pre-test contains questions about transformations that lead to congruent and similar images. It also covers angle relationships associated with triangles and parallel lines intersected by a transversal.
Inside Mathematics
Scatter Diagram
It is positive that how one performs on the first test relates to their performance on the second test. The three-question assessment has class members read and analyze a scatter plot of test scores. They must determine whether...
Curated OER
Podcasting Parabolas
Students explore parabolas. In this algebra and technology lesson, students construct the equation of a specific parabola, then take digital photos of real-life representations of these parabolas. Students create a podcast with a...
Curated OER
Graphs and Functions
Middle schoolers describe plotting functions on the Cartesian coordinate plane. They solve functions on paper and using an online tool to plot points on a Cartesian coordinate plane creating lines and parabolas.
Curated OER
Interpreting Graphs
Sixth graders interpret linear and nonlinear graphs. They create graphs based on a problem set. Next, they represent quantitive relationships on a graph and write a story related to graphing.
Illustrative Mathematics
Discounted Books
Adolescents love to shop, especially when an item is discounted. Here, shoppers only have a set amount of money to spend. Will they be able to make a purchase with the discount and tax added in? Percent discounts can be calculated...


