Charleston School District
The Line of Best Fit
If it's warm, they will come! Learners find a line of best fit to show a relationship between temperature and beach visitors. Previous lessons in the series showed pupils how to create and find associations in scatter plots. Now, they...
Curated OER
Patterns, Functions & Algebra
Students participate in numerous activities and games. In pairs, they play card games to find relationships between a random set of playing cards. After writing samples of Dear Abby letters concerning math problems, students create a...
Curated OER
Circle Art
Students investigate two and three dimensional shapes. In this geometry lesson plan, students write equations of circles and graph them correctly. They create pictures using circles.
Curated OER
Polynomials
Students add and subtract polynomials. In this polynomials assessment, students calculate ten questions using addition and subtraction. Students use Lego manipulatives to create their own worksheet on polynomials.
Curated OER
Using Tiles to Solve Word Problems
Students solve problems using equations. In this algebra lesson, students identify the correct symbols and steps when solving word problems. They graph their lines and analyze the slope using tiles.
Curated OER
Algebra: Lesson 4
Eighth graders participate in using algebraic proportional reasoning to find the missing amount that balances on a scale. Substitution is used to discover the missing objects on a scale. They answer multiple choice questions that are...
Curated OER
Graphing Inequalities
Students graph inequalities on a number line and discuss how to solve for one variable. The teacher models examples as students take notes. In groups, students participate in an activity to demonstrate inequalities on a number line. ...
Curated OER
Review of Algebra Topics
Eighth graders participate in a lesson that is intended to review topics of Algebra.They investigate the concepts of percent and solve problems. Students also solve equations that involve percent of change.
Curated OER
Five E Lesson Plans For Math
Students use the Five E method to solve problems. In this Five E lesson, students complete math lessons using the Engage, Explore, Explain, Elaborate, and Evaluate technique. They use the Five E's with lessons on tessellations, magnets,...
Curated OER
The Fractal Geometry of Nature
Learners identify patterns found in nature. In this algebra lesson, students model situation in nature using fractals. They investigate biological geometric structures and draw conclusion based on geometric concepts.
Curated OER
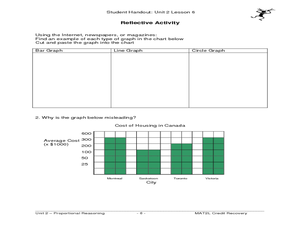
The Circle Graph
In this circle graph activity, students complete problems involving many circle graphs including a compass rose, degrees, and more. Students complete 7 activities.
Curated OER
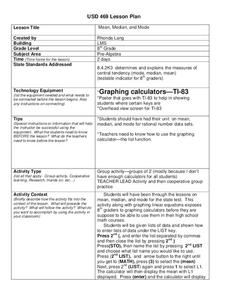
Mean, Median, and Mode
Eighth graders practice using the LIST key on graphing calculators using the proper syntax. They work with the functions of mean, median, and mode in a teacher led lesson and then with a partner on a second data set. They follow...
Curated OER
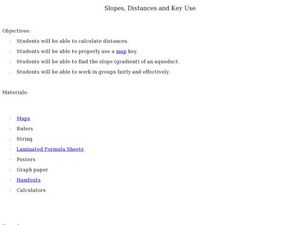
Slopes, Distances, and Map Keys
Students explore Rise and Run. In this math lesson, students use Rise and Run to find given slopes, they will use the slopes to calculate distances from point to point on graph paper.
Curated OER
Multiplication Mysteries
Arithmetic apprentices practice problem solving and multiplication with a lift-the-flap pair of reproducibles. In this Halloween mathematics lesson, math monsters practice multiplication by making candy corn calculations. They practice...
Curated OER
What's Your Shoe Size? Linear Regression with MS Excel
Learners collect and analyze data. In this statistics lesson, pupils create a liner model of their data and analyze it using central tendencies. They find the linear regression using a spreadsheet.
Illustrative Mathematics
Calculating and Rounding Numbers
Mathematicians need to know that not all numbers are rational. We approximate irrational number with rational numbers. That is why a calculator may be misleading. This task give learners an opportunity to see how rounding a number and...
Curated OER
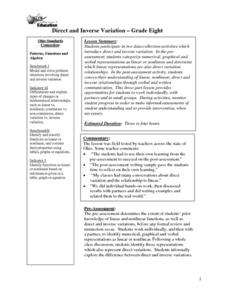
Direct and Inverse Variation
Eighth graders participate in two data collection activities that involve direct and inverse variation. In the pre-assessment, 8th graders categorize numerical, graphical, and verbal representations as linear or nonlinear and determine...
Curated OER
Getting it Right!
Young scholars investigate error. As shown in earlier activities from navigation lessons 1 through 3, without an understanding of how errors can affect position, one cannot navigate well. Students explore how computers can help in...
Curated OER
Three Squirrels and a Pile of Nuts
Students solve story problems using a spreadsheet in combination with various problem-solving strategies. Working in teams of three, students create attempt to solve a story problem using three different methods; using manipulative,...
Curated OER
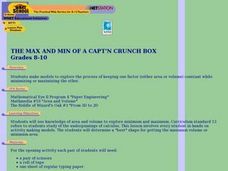
the Max And Min of a Capt'n Crunch Box
Students use knowledge of area and volume to explore minimum and maximum. They create models and determine a "best" shape for getting the maximum volume or minimum area.
Curated OER
Functions
Students explore a variety of functions. They recognize and describe functions and use linear functions to describe situations. Students find the domain and range of linear functions and graph rational expressions.
Curated OER
The Way to Better Grades!
Pupils collect and analyze data. In this statistics lesson, learners create a scatter plot from their collected data. They use, tables and graphs to analyze the data and mae decisions.
Curated OER
Math Mediator Lesson 10: Slope
Students explore the concept of slope. In this Algebra I lesson, students investigate the definition of slope as rise over run or change in y compared to change in x. The lesson includes a real-world problem in which the height of high...
Curated OER
Basic Algebra and Computers: Spreadsheets, Charts, and Simple Line Graphs
Students, while in the computer lab, assess how to use Microsoft Excel as a "graphing calculator." They view visual representations of line graphs in a Cartesian plane while incorporating basic skills for using Excel productively.
Other popular searches
- Solving Equations Hands On
- Hands on Equations Lesson #8
- Hands on Equations Lesson 1
- Hands on Equations Lesson 16
- Hands on Equations Lesson 5
- Hands on Equations Lesson 14
- Hands on Equations Lesson 7
- Algebra Hands on Equations
- Hands on Equations Lesson #1
- Hands on Equations Math
- Hands on Equations Lesson 9
- Hands on Equations Lesson#21


