Curated OER
Slope of a Line
In this slope of a line worksheet, students solve and graph 2 different problems that include determining the slope of a line using the equation y=mx+b. First, they define the slope of a line and the y-intercept. Then, students use the...
Curated OER
Graphing Linear Equations
In this graphing linear equations worksheet, students plot 22 lines on their coordinate grids. When directions are followed carefully, the result is a picture.
Curated OER
Learning to Make Line Graphs
Students analyze data and create a line graph. In this graphing lesson, students explore data from a previous experiment and plot the information on a line graph. Students analyze their findings.
Curated OER
Introduction to Graphs: Bar Graphs, Line Graphs, Circle Graphs
In this graphing data worksheet, middle schoolers answer 5 short answer questions about graphs. Students determine which type of graph best represents various data sets.
EngageNY
The Slope of a Non-Vertical Line
This lesson introduces the idea of slope and defines it as a numerical measurement of the steepness of a line. Pupils then use the definition to compare lines, find positive and negative slopes, and notice their definition holds for...
EngageNY
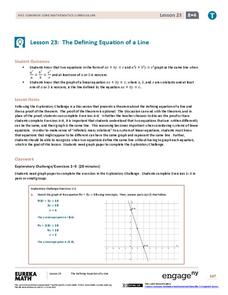
The Defining Equation of a Line
They appear to be different, yet they are the same line. Part 24 out of 33 lessons provides a theorem about the relationships of coefficients of equivalent linear equations. Pupils use the theorem to determine whether two equations are...
Virginia Department of Education
Graphs
Examine different types of graphs as a means for analyzing data. Math scholars identify the type of graph from a series of data displays and then develop questions to match each one. Then, given a scatter plot of height versus age data,...
CK-12 Foundation
Line Graphs to Display Data Over Time: Strawberry Competition
Take the tediousness out of graphing. Using the interactive tool, learners can efficiently create a line graph from a set of data. They then use the graph to answer questions about specific trends in the data.
CK-12 Foundation
Broken-Line Graphs: Heating Curve of Water
Examine the unique graphs coined broken-line graphs. Using the phase change of water for data, learners answer questions related to the temperature and energy at different times in the cycle of the phase change. Questions focus on the...
EngageNY
The Computation of the Slope of a Non-Vertical Line
Determine the slope when the unit rate is difficult to see. The 17th part of a 33-part series presents a situation that calls for a method to calculate the slope for any two points. It provides examples when the slope is hard to...
Curated OER
Animal Brains
Do big bodies make big brains? Let your learners decide whether there is an association between body weight and brain weight by putting the data from different animals into a scatterplot. They can remove any outliers and then make a line...
EngageNY
The Graph of a Linear Equation in Two Variables Is a Line
Show your class that linear equations produce graphs of lines. The 20th segment in a unit of 33 provides proof that the graph of a two-variable linear equation is a line. Scholars graph linear equations using two points, either from...
EngageNY
There is Only One Line Passing Through a Given Point with a Given Slope
Prove that an equation in slope-intercept form names only one line. At the beginning, the teacher leads the class through a proof that there is only one line passing through a given point with a given slope using contradiction. The 19th...
EngageNY
Characteristics of Parallel Lines
Systems of parallel lines have no solution. Pupils work examples to discover that lines with the same slope and different y-intercepts are parallel. The 27th segment of 33 uses this discovery to develop a proof, and the class determines...
Mathematics Assessment Project
Comparing Lines and Linear Equations
Scholars first complete an assessment task on writing linear equations to model and solve a problem on a running race. They then take part in a card matching activity where they match equations and graphs of lines to diagrams of fluid...
Virginia Department of Education
Graphing Linear Equations
Combine linear equations and a little creativity to produce a work of art. Math scholars create a design as they graph a list of linear equations. Their project results in a stained glass window pattern that they color.
Charleston School District
The Line of Best Fit
If it's warm, they will come! Learners find a line of best fit to show a relationship between temperature and beach visitors. Previous lessons in the series showed pupils how to create and find associations in scatter plots. Now, they...
EngageNY
Informally Fitting a Line
Discover how trend lines can be useful in understanding relationships between variables with a instructional activity that covers how to informally fit a trend line to model a relationship given in a scatter plot. Scholars use the trend...
Curated OER
Pizza Possibilities
Middle schoolers create and interpret line plots, bar graphs, and circle graphs. The lesson assumes mastery of conversions from fraction to decimal to percent, construction of angles, and at least an introduction to graphs displaying data.
Curated OER
Contour and Cross-Section Skills
In this geography worksheet, learners identify the Wolf Creek Crater and how it was formed. They examine a contour map given of how the crater would look from above. Then, pupils use a ruler to draw lines as on the graph to the side....
Curated OER
What's in a Graph?
Students explore how to use and interpret graphs. The graphs are pulled from a variety of sources, and the activities ask students to interpret graphs. They start this lesson with knowledge of what a graph is. Students also know how to...
Curated OER
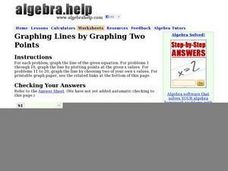
Graphing Lines by Graphing Two Points
Use a graphing lines worksheet to have your mathematicians graph the line of a given equation and plot specified points. The first 10 problems have a given equation, and two values. The next 10 problems have a given equation, but your...
Curated OER
Line Graphs
In this line graphs worksheet, 8th graders solve and complete 20 different problems that include reading various line graphs. First, they use the information provided in each line graph to determine the correct response to each of the...
PHET
Graphing Slope-Intercept
Slope-intercept form ... perhaps it has something to do with slope and intercepts? An easy-to-use interactive lets users adjust the locations of two points on a line. The interactive automatically updates the slope-intercept form of the...


