CK-12 Foundation
Input-Output Tables for Function Rules
How does changing a graph affect the function? Learners watch the changing input-output table as they adjust the location of the line graph. Questions prompt them to complete a table of values and determine the function rule.
Texas Instruments
Is It or Isn't It Proportional
How can you tell if number relationships are proportional? Mathematicians investigate proportional relationships. They compare and contrast functions and graphs to determine the characteristics of proportional relationships, as well as...
Concord Consortium
Betweenness II
Read between the curves ... quadratic curves! Young scholars analyze the graphs of two quadratic functions by writing their own function whose outputs are between the two given. They then consider intersecting quadratic functions and...
Mathed Up!
Straight Line Graphs
Develop graphs by following the pattern. The resource provides opportunities for reviewing graphing linear equations. Pupils create tables to graph linear equations by using patterns whenever possible. The worksheet and video are part of...
EngageNY
Relationships Between Quantities and Reasoning with Equations and Their Graphs
Graphing all kinds of situations in one and two variables is the focus of this detailed unit of daily lessons, teaching notes, and assessments. Learners start with piece-wise functions and work their way through setting up and solving...
CK-12 Foundation
Function Rules for Input-Output Tables: Function Machine 2
Model function operations using a function machine. An interactive lesson has learners determine the patterns of a double function machine. They use the patterns to write functions and make connections between the inputs and outputs.
Curated OER
Introduction to Functions
Students explore functions, function rules, and data tables. They explore terms of linear functions. Students use computers to analyze the functions. Students write short sentences to explain data tables and simple algebraic expressions.
Curated OER
Functions & Algebra
Young scholars examine linear equations. For this functions and algebra lesson, students write equations in the slope-intercept form. They enter data in a graphing calculator, examine tables, and write linear equations to match the data.
Curated OER
Functions and the Vertical Line Test
Students examine functions and function notation. They use computer activities to discover how to graph functions, and conduct a vertical line test. Students describe spatial relationships using coordinate geometry.
Curated OER
Graphing Linear Functions
In this linear functions worksheet, students graph 3 linear functions. Students graph each function by making a table of values given a linear function in standard form.
Curated OER
Graphing Linear Functions Two
Use this graphing linear functions worksheet to have learners graph three linear equations. They use a table of values, the intercept method, and slope-intercept form to graph three functions.
Curated OER
Using Data Analysis to Review Linear Functions
Using either data provided or data that has been collected, young mathematicians graph linear functions to best fit their scatterplot. They also analyze their data and make predicitons based on the data. This instructional activity is...
Curated OER
Frequency Tables and Stem-and-Leaf Plots
Students are introduced to the function of frequency tables and stem and leaf plots. In groups, they determine the frequency of their teacher coughing, ringing a bell or raising their hand. To end the lesson plan, they determine...
Math Mammoth
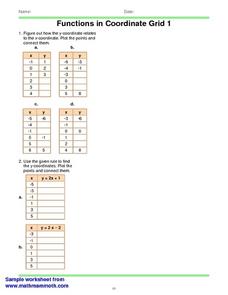
Functions in Coordinate Grid 1
In this math worksheet, students are given 4 tables of x-y coordinates and a grid. Students figure the relationship between the x and y coordinate and plot the points. Students then use a given rule to find the y coordinate.
Curated OER
Patterns and Algebra - Modeling
Seventh grade math is so much fun! They solve 10 different problems that include using patterns to complete a table, describe the pattern, and identify the specific term in the pattern for each. Then they give a description of the...
Curated OER
Fast Talker - Ch 2 project
Tongue Twisters?! Create scatter plot graphs based on timing fellow classmates saying tongue twisters. Then investigate, display, and analyze the relationships based on functions. Wrap up this activity by making a poster or other...
Curated OER
Making Connections
Eighth graders investigate the input/output model for building function tables. From the data, 8th graders connect tables, graphs, function rules, and equations in one variable. They work backwards to determine function rules for given...
Illustrative Mathematics
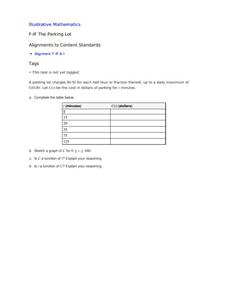
The Parking Lot
Use the real-world cost of parking a car to demonstrate the properties of a function. The resource describes to learners how much it is to park in a certain lot. It is up to your number crunchers to complete a table of minutes and...
Willow Tree
Linear Relationships
There's just something special about lines in algebra. Introduce your classes to linear equations by analyzing the linear relationship. Young mathematicians use input/output pairs to determine the slope and the slope-intercept formula to...
EngageNY
Linear and Nonlinear Expressions in x
Linear or not linear — that is the question. The lesson plan has class members translate descriptions into algebraic expressions. They take the written expressions and determine whether they are linear or nonlinear based upon the...
Annenberg Foundation
Skeeters Are Overrunning the World
Skeeters are used to model linear and exponential population growth in a wonderfully organized lesson plan including teachers' and students' notes, an assignment, graphs, tables, and equations. Filled with constant deep-reaching...
Curated OER
Equations from Unit Rates
Your class can become linear equations masters, as they calculate the rate of change of a function. They observe different types of coordinates as they relate to a graph, then use the Ti-navigator to move the line around and draw...
5280 Math
Aquarium Equations
Take a look at linear functions in a new environment. A three-stage algebra project first asks learners to model the salt concentration of an aquarium using linear functions. Then, using iterations, pupils create a set of input-output...
02 x 02 Worksheets
Inverse Variation
Discover an inverse variation pattern. A simple lesson plan design allows learners to explore a nonlinear pattern. Scholars analyze a distance, speed, and time relationship through tables and graphs. Eventually, they write an equation to...
Other popular searches
- Function Tables 5th Grade
- Function Tables and Graphs
- Algebra Function Tables
- Function Tables Word Problems
- Linear Function Tables
- Patterns and Function Tables
- Graph Function Tables
- Math Function Tables
- Function Tables and Algebra
- Nd Function Tables
- Graphing Function Tables
- Function Tables Ell


