Curated OER
Organising Data
Students complete data organization activities. In this data organization lesson plan, students watch online clips about organizing data. Students complete an eye color frequency table for their class. Students watch a clip about asking...
Curated OER
ou are the Researcher!
Students conduct a census at school. They collect data, tally it, and create a frequency table. Students display their data in three different types of graphs. They write complete sentences describing the graph.
Shodor Education Foundation
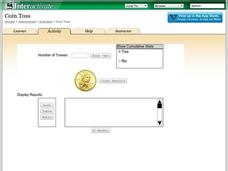
Coin Toss
Are your young mathematicians having a hard time making heads or tails of probabilities? It's no toss up—here is a resource that's sure to straighten them out! Learners run the interactive to toss a coin a different number of times....
Curated OER
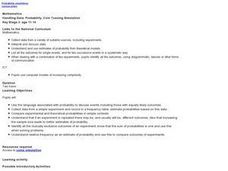
Handling Data: Coin Tossing Simulation
Students collect experimental data and record it on a frequency table. After accessing an Internet coin toss simulation site they discover that repetition of an experiment may result in different outcomes. They identify the mutually...
Curated OER
Are Taxes "Normal?"
Students explore the concept of normal distribution. In this normal distribution lesson, students find the normal distribution of taxes in the 50 US states. Students make histograms, frequency tables, and find the mean and median of tax...
Curated OER
Organizing and Interpreting Data
In this organizing and interpreting data worksheet, students solve and complete 10 different problems related to reading various data tables. First, they complete the 3 charts shown with the correct tally amount, frequency amount, and...
Curated OER
Frequency, Histograms, Bar Graphs
In this statistics worksheet, students plot and graph their data, then interpret the data using the correct form of graphs. There are 3 detailed questions with an answer key.
Curated OER
A Picture is Worth a Thousand Words: Introduction to Graphing
Students practice graphing activities. In this graphing lesson, students discuss ways to collect data and complete survey activities. Students visit a table and graphs website and then a create a graph website to practice graphing.
Queensland Government
Means, Modes And Medians
Middle schoolers identify the mean, mode, and median of the heights for males and females who are age 13. They describe the difference between the three words and what each signifies. Finally, pupils fill in a table and calculate the...
Curated OER
Code Breakers
Learners collect data and make a frequency table, change ratios into percents, and analyze data to make predictions.
Curated OER
ng Data: Probability, What's in the bag?
Young scholars use the language associated with probability to discuss events including those with equally likely outcome. They collect data from a simple experiment and record in a frequency table: estimate probabilities based on this...
Curated OER
Probabilities for Number Cubes
Middle schoolers explore the concept of probability. In this probability lesson, students roll a six-sided number cube and record the frequency of each outcome. Middle schoolers graph their data using a frequency chart and keep tally...
Curated OER
Mr. Cobbler's Shoe Dilemma
Students employ statistics to solve real-world problems. They collect, organize and describe data. They make inferences based on data analysis. They construct, read, and interpret tables, charts and graphs.
Curated OER
Probability Two Events
Students investigating the concept of probability practice the concept using a variety of different example problems. The lesson plan is delivered in a question and answer format. The frequency of answers is recorded in a data table for...
Curated OER
Paper Parachutes
Students participate in a simulation of a parachute-jump competition by making paper parachutes and then dropping them towards a target on the floor. They measure the distance from the point where the paper parachute lands compared to...
Curated OER
Probability at Play
For this probability worksheet, students read data regarding a ring toss game and respond to 4 short answer questions pertaining to probability.
Curated OER
Questionnaires and Analysis
Students, review the techniques and different types of data analysis as well as how they are expressed, identify why facts and data are needed in conclusion of a questionnaire. The concepts of qualitative and quantitative data are...
Mathed Up!
Stratified Sampling
Young mathematicians learn how to solve problems involving stratified sampling. They review concepts of sampling and proportionality by watching a video and then they complete a activity of questions on this topic.
Curated OER
Analyzing Discrete and Continuous Data in a Spreadsheet
You are what you eat! Your statisticians keep a log of what they eat from anywhere between a day to more than a week, keeping track of a variety of nutritional information using a spreadsheet. After analyzing their own data, individuals...
Raytheon
Data Analysis and Interpretation
For this data analysis and interpretation worksheet, learners use charts, graphs, statistics to solve 42 pages of problems with answer key included.
Curated OER
Count The Letters
Students perform activities involving ratios, proportions and percents. Given a newspaper article, groups of students count the number of letters in a given area. They use calculators and data collected to construct a pie chart and bar...
Curated OER
Great Graphing
Young scholars collect data, use a computer spreadsheet program to create various graphs, and compare the graphs. They state the findings of each graph in writing and decide which graph type best represents the data.
Mathematics Assessment Project
Mean, Median, Mode, and Range
What a find! Here is a lesson plan, designed to meet sixth grade math Common Core standards, that focuses on the calculation of different measures of center for the scores from a penalty shoot-out competition. An independent...
Math Guy
Algebra 1 Practice Final
What makes this resource special? The amazing answer key that comes with worked out solutions and notes for each problem. Practice problems include all topics ranging from linear systems to simplifying exponential expressions. The packet...
Other popular searches
- Frequency Tables Line Plots
- Math Frequency Tables
- Making Frequency Tables
- Reading Frequency Tables
- Creating Frequency Tables
- Cumulative Frequency Tables
- Frequency Tables 7th Grade
- Intro to Frequency Tables
- Making Frequency Tables Quiz


