Curated OER
T Points from Directions
Here is a activity that starts with having geometers translate points using compass directions into an accurate picture of the problem. Then they must use their knowledge of the Pythagorean theorem or similar triangles to solve. This...
Illustrative Mathematics
Friends Meeting on Bikes
It is the job of your mathematicians to figure out how fast Anya is riding her bike when meeting her friend. The problem shares the distance, time spent riding, and Taylor's speed leaving the last variable for your learners to solve. Use...
Curated OER
Diagonals to Quadrilaterals II
Students identify the properties of different polygons. In this geometry lesson plan, students find the slope of a line and calculate the distance between two lines. They differentiate between similar and congruent polygons.
Curated OER
The Distance to an Unapproachable Point
Pupils use geometry or trigonometry to measure the distance of a far off point. They verify their measurements using a tape measure to check their work.
Willow Tree
Scientific Notation
Numbers that are very large or very small are difficult to express in standard notation. Pupils learn how to convert between standard and scientific notation. They also multiply and divide the numbers in scientific notation.
Curated OER
Shape Tool
Students explore various polygons and examine how shapes can be manipulated in a variety of ways. In this shape tool instructional activity, students identify geometric shapes in two dimensions. Students identify and draw one line of...
West Contra Costa Unified School District
Solving Inequalities
What does translating points on a number line have to do with solving inequalities? Young mathematicians first learn about translations of points on a number line, and then use this information to solve linear inequalities in one variable.
Illustrative Mathematics
Walk-a-thon 1
Your mathematician's job is to explore the relationship between hours and miles walked during a walk-a-thon. The activity compels your learners to experiment with different means in finding out this proportional relationship. The answer...
EngageNY
Constant Rates Revisited
Find the faster rate. The resource tasks the class to compare proportional relationships represented in different ways. Pupils find the slope of the proportional relationships to determine the constant rates. They then analyze the rates...
Curated OER
Where am I Located
Students calculate and find a certain location. In this geometry instructional activity, students examine a coordinate plane for pair of coordinates. They calculate the distance between point using the distance formula and estimation.
Curated OER
Chart Your Course
Students explore change represented in graphs comparing distance and time. They exchange and share their graphs. Students interpret and create distance versus time line-graphs, and write stories based on these graphs. They interpret a...
Curated OER
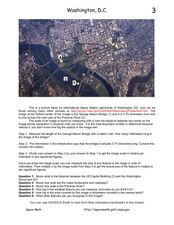
Washington D.C. from Space
In this Washington D.C. from space worksheet, students use a picture generated by the International Space Station and they find the scale of the image. They determine the actual size of features in the image, they find the distances...
Curated OER
Craters on the Moon
In this moon craters worksheet, students use a high resolution image of the lunar surface and calculate the image scale in meters per millimeter. They use the image scale to find the largest crater in the image, the smallest crater, the...
Curated OER
The Shortest Line Mystery
Students calculate the shortest distance of various scenarios. In this algebra lesson, students interpret graphs of optimization problems. They use a graphing calculator to assist them in graphing and making predictions.
PBS
Working with Coordinate Planes: Activities and Supplemental Materials
Seven activities make up a collection of supplemental materials to reinforce graphing on a coordinate plane. Worksheet objectives include plotting coordinates within single and four quadrants, measuring straight and diagonal lines, and...
Curated OER
Hinode-Close Up of a Sunspot
In this solar sunspot activity, students use two photographs from the Hinode solar observatory showing a sunspot on the solar surface. Students solve 5 problems including finding the scale of the images, determining the smallest detail...
Charleston School District
3D Applications of the Pythagorean Theorem
How many right triangles can you find in a prism, cone, or pyramid? Using right triangles to find lengths in three-dimensional figures is the focus of the lesson. After working with the Pythagorean Theorem to find missing side lengths...
AIMS Education Foundation
Classroom Olympics
As the Summer Olympics are approaching, incorporate Olympic-type games into the classroom. From straw javelin to cotton ball shot put, these games are sure to keep leaners engaged. The best part is that there is math involved! Pupils...
Charleston School District
Review Unit 8: Geometry Applicaitons
Pupils complete a review worksheet that highlights the key problems from the first eight lessons in the series. Topics include the Pythagorean Theorem and its converse, as well as finding volume of three-dimensional figures.
Illustrative Mathematics
Bike Race
A graph not only tells us who won the bike race, but also what happened during the race. Use this resource to help learners understand graphs. The commentary suggests waiting until the end of the year to introduce this topic, but why...
Curated OER
Seeing Solar Storms in STEREO-I
In this geometric calculations of solar storms activity, students use a diagram indicating the location of 2 STEREO satellites, the earth and the sun to calculate the distance between a Coronal Mass Ejection and the Earth. They use...
Curated OER
Length Lab
In this science worksheet, students identify and explain what each unit represents and how much each one equals. Then they use a metric ruler to locate each measurement and write it on the line. Students also locate the distance between...
Curated OER
Shake It Up with Scatterplots
Students identify how to use a scatterplot to compare two sets of data to determine if they are related. Then they identify and describe the definition of regression line (the "line of best fit"). Students also identify how scientists...
Alaska Department of Education
Mathematics Reference Sheet
Triangles and prisms don't stand a chance when your learners use this handout full of the formulas they need to know about the different shapes. Area, volume, and surface formulas are all covered along with the standard measurement and...


