Charleston School District
Equations of Linear Functions
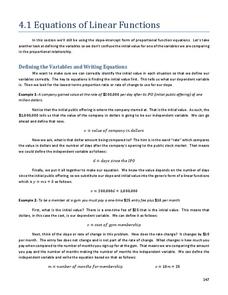
Teaching linear function relationships using contextual information is beneficial to pupils' understanding. The lesson uses problem solving to build linear functions given different information for each problem. This is the second in a...
Virginia Department of Education
Functions 1
Scholars learn what it means for a relation to be a function and see various representations of functions. After learning the definition, they participate in a card sorting activity classifying relations as functions or not.
Charleston School District
Graphing Functions
How do letters and numbers create a picture? Scholars learn to create input/output tables to graph functions. They graph both linear and nonlinear functions by creating tables and plotting points.
Charleston School District
Graphs of Linear Functions
What does a slope of 2/3 mean? Develop an understanding of the key features of a linear function. Pupils graph the linear functions and explain the meaning of the slope and intercepts of the graphs.
EngageNY
Using Linear Models in a Data Context
Practice using linear models to answer a question of interest. The 12th installment of a 16-part module combines many of the skills from previous lessons. It has scholars draw scatter plots and trend lines, develop linear models, and...
02 x 02 Worksheets
Inverse Variation
Discover an inverse variation pattern. A simple lesson plan design allows learners to explore a nonlinear pattern. Scholars analyze a distance, speed, and time relationship through tables and graphs. Eventually, they write an equation to...
Virginia Department of Education
Determining Direct Variation
Once learners realize what direct variation is, they see it's just a type of linear function. The instructional activity poses a general question that leads to the creation of the y = kx formula. The resource includes discussion prompts...
Charleston School District
Intro to Functions
How are functions related to chicken nuggets? A video teaches the concept of a function using the idea of a nugget-making machine as an analogy for a function machine. Learners determine if a relation is a function from an equation and a...
Virginia Department of Education
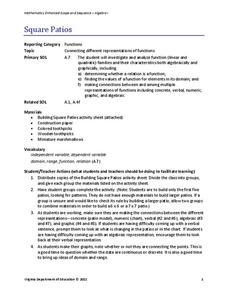
Square Patios
Build a patio from toothpicks and marshmallows to analyze functions! Learners look for patterns in the data as they create different size patios. As they discover patterns, they make connections between the different representations of...
Google
The Law of Large Numbers and Probability
Learners investigate why theoretical probability doesn't always match reality. The activity involves using Python 2.7 (or Sage) to set up a Bernoulli Trial. It also involves setting up a spreadsheet to simulate the Birthday Paradox....
Illustrative Mathematics
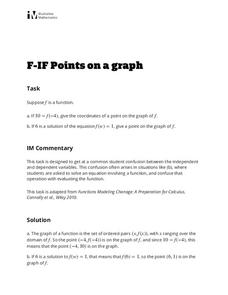
Points on a Graph
Learners practice using their knowledge of how to interpret a function and use function notation. The activity includes two questions. Given an input of a function and its output, the first question asks learners to write the ordered...
Cherry Creek Schools
Physical Science Final Exam Review Packet
If you need a way to assess the concepts in your physical science class, use an extended set of worksheets as a midterm or final exam. It includes questions about density, physical and chemical matter, speed and velocity, weight and...
Virginia Department of Education
Linear Modeling
An inquiry-based algebra lesson explores real-world applications of linear functions. Scholars investigate four different situations that can be modeled by linear functions, identifying the rate of change, as well as the strength and...
Curated OER
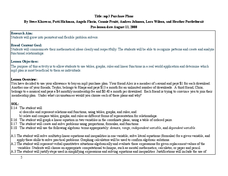
MP3 Purchase Plans
Use algebra to solve real world problems. Mathematicians practice use of graphs, tables, and linear functions to solve a problem regarding mp3 purchase plans. They work in groups to solve the problem and present their findings and...
Curated OER
Functions and Their Graphs
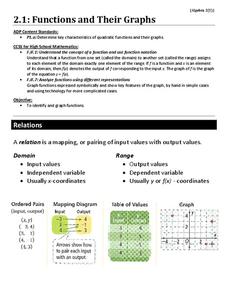
Use a worksheet to go over the basic concepts of relations and functions. Included are clear definitions and examples of relations, domain and range, and functions and the vertical line test. However, the problems are pretty basic. A...
Curated OER
Graphs and Transformations of Functions
Is it possible to solve quadratic equations by factoring? It is, and your class will graph quadratic equation and functions too. They perform transformation on their graphs showing increasing and decreasing intervals, domain, and range....
Virginia Department of Education
Slippery Slope
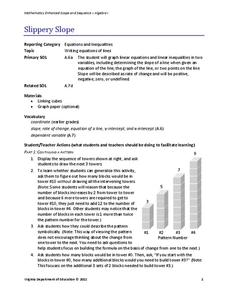
Explore slope using geometric patterns. Young mathematicians investigate towers built from cubes to develop a linear pattern. They move the data to a coordinate plane to connect the pattern to slopes.
Virginia Department of Education
The Submarine
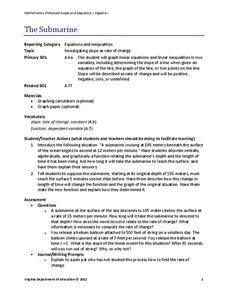
Submerge yourself in the study of slope. Scholars investigate a situation involving slope and the rate of change of a submarine. An additional example further explores the concept of slope by changing one of the conditions of the submarine.
Curated OER
Is there Treasure in Trash?
More people, more garbage! Young environmentalists graph population growth against the amount of garbage generated per year and find a linear model that best fits the data. This is an older resource that could benefit from more recent...
Curated OER
Drug Sales Soar - Rate of Change
In this prescription drug worksheet, learners answer short answer questions and create graphs on the sales of prescription drugs over a five year span. Students complete six questions.
Illustrative Mathematics
Riding by the Library
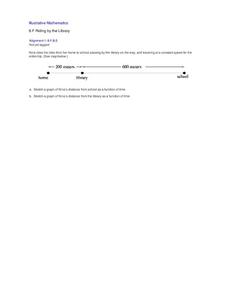
Draw a graph that shows the qualitative features of a function that has been described verbally. Make sure learners understand where time is zero and the distance is zero. It may take them some time to understand this concept, so working...
Curated OER
Introduction to Functions
Students explore functions, function rules, and data tables. They explore terms of linear functions. Students use computers to analyze the functions. Students write short sentences to explain data tables and simple algebraic expressions.
Curated OER
Calculator-Based Lessons Help Examine Real-World Data
Students may determine equations based on graphs and regression models.
Illustrative Mathematics
High School Graduation
An exercise in finding the approximate time that a name would be called at a graduation. Estimating time may be difficult for some of the class, so this resource would not be a good choice for learning this standard. It does end with a...


