Curated OER
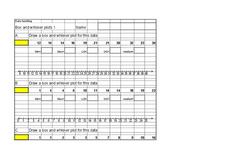
What is a Box and Whisker Plot?
Eighth graders explore the correct use of box and whisker plors. The times when they are appropriate to use to compare data is covered. They plot data according to statistical analysis including mean, median, and mode.
Curated OER
comparison of Two Gender Sports Teams
Students gather data on sports team and create a box and whisper plot. In this data collection lesson, students find the median, the quartile range, and relationships between variables.
Curated OER
Steppin' Out
Learners are presented with the question: "Do longer legged people run faster than shorter legged people?" Students conduct an experiment, collect their data, create box and whisker plots using a computer and graphing program, and...
Curated OER
Statistics
For this statistics worksheet, students solve and complete 6 different problems that include determining various types of statistics. First, they determine the data set where the median value is equal to the mean value. Then, students...
Curated OER
Who's got the fastest legs?
Students use a stopwatch to collect information for a scatterplot. In this fastest legs lessons, students collect data through the taking of measurements, create and find a median number. Students develop an equation and answer...
Curated OER
Measures of Central Tendency
In this measures of central tendency worksheet, students solve and complete 6 different problems. First, they count the number of items in each set of data. Then, students determine the mean, median and mode for each. In addition, they...
Curated OER
Statistics - Central Tendency
In this statistics activity, students solve and complete 13 different problems that include creating various box-and-whisker plots. First, they write a definition for mean, median, mode and range. Then students explain how to determine...
Mathed Up!
Scatter Graphs
Make an estimate by getting in line. The class works with scatter plots and lines of best fit to make an estimate for given values. Pupils determine whether there is a positive or negative correlation and draw a best-fit line. Using the...
Curated OER
Box and Whisker Plots
In this math learning exercise, students compute the median of sets of numbers. They create box and whisker plots. Students identify the median, upper and lower quartiles, and minimum/maximum amounts. On the last page of this learning...
Texas Instruments
Light and Day
Pupils explore the concept of collecting data as they collect data on their graphing calculator about time, temperature, and light. Learners plot the data and create histograms and box and whisker plots to analyze the data.
Curated OER
Data Management and Probability: Applications
In this data management and probability applications worksheet, 8th graders solve 20 various types of probability problems. They find the mean, median, mode and range of various numbers. Then, students use the spinner illustration to...
American Statistical Association
Armspans
Young mathematicians collect data on the arm spans of classmates. Then they sort the data by measures of center, spread, and standard deviation. Finally, they compare groups, such as boys and girls, to interpret any differences.
Curated OER
Box-and-Whisker Plots 1
In this math instructional activity, students find the values for the numbers that are presented in the sheet and create two box and whisker plots.
American Statistical Association
How Tall and How Many?
Is there a relationship between height and the number of siblings? Classmates collect data on their heights and numbers of brothers and sisters. They apply statistical methods to determine if such a relationship exists.
American Statistical Association
Bear Hugs
Scholars research arm span to determine who gives the best bear hugs. They use data from a national study to find the standard statistics for arm span. It includes mean, median, quartiles, spread, standard deviation, and more.
CK-12 Foundation
Graphs in the Coordinate Plane: Functions on a Cartesian Plane
Connect the dots to graph a linear function. Young mathematicians use an interactive to first plot provided points on a coordinate plane. They connect these points with a line and then answer questions about the slope and y-intercept of...
Curated OER
Stem-and- Leaf Plots
Learners are introduce to the notion of stem-and-leaf plots. They use stem-and-leaf plots to calculate the mean, median, and mode of a set of data. Students use computers to learn about stem-and-leaf plots.
Curated OER
Organizing and Interpreting Data
In this organizing and interpreting data worksheet, students solve and complete 10 different problems related to reading various data tables. First, they complete the 3 charts shown with the correct tally amount, frequency amount, and...
Curated OER
The Dog Days of Data
Young scholars are introduced to the organization of data This lesson is designed using stem and leaf plots. After gather data, they create a visual representation of their data through the use of a stem and leaf plot. Students...
Curated OER
Measures of Central Tendencies: Quartiles
In this statistics activity, learners calculate the mean, median, mode, range, lower quartile, and upper quartile for 10 questions and interpret a box and whiskers graph.
Curated OER
Measures of Central Tendency
In this measures of central tendency worksheet, students find the mean, mode and range of given sets of data. They interpret box-and-whisker graphs and stem-and-leaf plots. This two-page worksheet contains eleven multi-step problems.
American Statistical Association
Step into Statastics
Class members study the size of classmates' feet and perform a statistical analysis of their data. They solve for central tendencies, quartiles, and spread for the entire group as well as subgroups. They then write a conclusion based on...
Curated OER
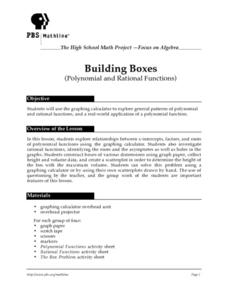
Building Boxes- Polynimial And Rational Functions
Young scholars investigate the concepts of polynomial and rational functions. They identify the general patterns used to solve problems. The use of real world contexts in the problems helps to promote engagement and understanding of how...
American Statistical Association
Don't Spill the Beans!
Become a bean counter. Pupils use a fun activity to design and execute an experiment to determine whether they can grab more beans with their dominant hand or non-dominant hand. They use the class data to create scatter plots and then...
Other popular searches
- Analyzing Box Plots
- Outliers Box Plots
- Interpret Box Plots
- Graphs Box Plots
- Analysing Box Plots
- Leaf Box Plots
- Statistics Box Plots
- Conclude Box Plots
- Box Plots Worksheets
- Double Box and Whisker Plots
- Scatterplot Box


