CK-12 Foundation
Venn Diagrams: Planets and Dwarf Planets of the Solar System
Yes, Venn diagrams are helpful in science, too. Learners use an interactive to classify celestial bodies as having moons, as dwarf plants, as both, or as neither. They answer a set of challenge questions based on the Venn diagrams they...
CK-12 Foundation
Venn Diagrams: T-Shirt Mystery
Sorting your t-shirts is easy with Venn diagrams. Individuals use a drag and drop interactive to classify shapes on t-shirts into Venn diagrams. A set of challenge questions tests whether the classification is correct.
Curated OER
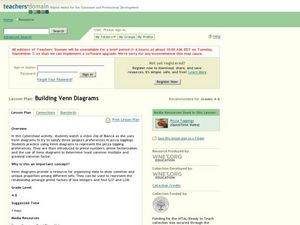
Building Venn Diagrams
Students use Venn diagrams to solve prime number and factorization problems. In this multiplication lesson, students watch a video and use a Venn Diagram to help them solve a pizza math activity that uses prime factorization. Students...
Curated OER
Answer the Questions Based on the Venn Diagram
In this Venn diagram worksheet, students answer 6 questions about a Venn diagram. Students determine the number of students who like soccer and tennis.
Curated OER
Sets an the Venn Diagram
Learners explore the characteristics of sets and Venn Diagrams. Given data, students practice determining the placement of elements in a Venn Diagram. Learners discuss the correspondence between data sets and their graphical...
Curated OER
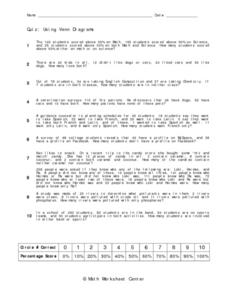
Using Venn Diagrams
In this Venn Diagrams worksheet, students complete and draw 10 different Venn Diagrams to match each problem as described. First, they determine the number of kids who scored above half on math or science. Then, students compare the...
Curated OER
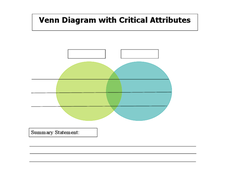
Venn Diagram with Critical Attributes
In this Venn diagram graphic organizer worksheet, students compare and contrast an item using the overlapping diagram. Students also list critical attributes in the space provided.
Curated OER
Venn Diagram-Two Circles
In this Venn Diagram worksheet, students analyze the union, intersection, and subtraction of three sets of Venn Diagrams.
Curated OER
Using Diagrams in Problem Solutions
Students use tables, graphs and diagrams to collect data. In this problem solving with diagrams lesson plan, students construct their own tables and graphs containing information they gather from a drawing. They also make a Venn Diagram...
CK-12 Foundation
Sets: Bikes or Boards?
Do people ride, slide, or do both? Pupils use an interactive Venn diagram for the numbers of people owning bicycles, owning skateboards, or both. An interactive provides questions for them to answer using the diagram.
Curated OER
Everybody Needs a Rock
Students, after making quantitative and qualitative observations of their rocks, construct a Venn diagram or dichotomous key to classify their rocks.
West Contra Costa Unified School District
Introduction to Conditional Probability
Here is a turnkey lesson that walks young statisticians through the development and uses of conditional probability. From dice games to surveys, Venn diagrams to frequency tables, the class learns how a given can effect the overall...
Curated OER
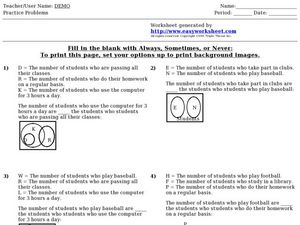
Sets: Always, Sometimes, or Never
In this sets worksheet, students solve 4 fill in the blank problems. Students determine if the given statement about a diagram is always, sometimes, or never true. Students use diagrams to determine which set of people overlap.
Math12
Basics of Probability
Give your middle schoolers a fighting chance at understanding probability. Offering numerous examples that clearly demonstrate basic probability concepts, this resource helps young mathematicians learn how to visualize the...
Curated OER
Geo Jammin'
Students compare and contrast related two- and three-dimensional shapes, and complete a Venn diagram illustrating the attributes of each. Using a poem pattern from another lesson, students use data from the diagram to write an attribute...
Curated OER
Do You Have Number Sense?
Seventh graders are grouped according to their ability level with a captain who is elected by the students in that particular group. Students demonstrate their knowledge of rational and irrational numbers by defining them. Students use a...
Curated OER
Venn Diagrams & Word Problems
Learners explore the concept of Venn Diagrams through word problems. In this Venn Diagram lesson plan, students solve word problems about groups of people using Venn Diagrams. Learners use survey results about MySpace and Facebook in a...
Curated OER
In the Loop
Students practice comparing items by using a Venn diagram. In this diagram lesson, students divide a group of similar buttons by the small details that separate them using a Venn Diagram. Students compare and contrast shapes by their...
Digging Into Math
Classifying Triangles
Young mathematicians explore the world of three-sided shapes in this lesson on the different types of triangles. Starting with a general introduction to classification using Venn diagrams, children learn how to categorize triangles based...
Math Stars
Math Stars: a Problem-Solving Newsletter Grade 7
Put on your thinking caps because middle school math has never been more interesting in this huge resource full of thought provoking questions. Written as a newsletter, the resource has 10 two-page newsletters with a variety of...
Curated OER
Classifying Polygons
Seventh graders participate in a polygon hunt. In this polygon lesson, 7th graders examine how polygons are alike and different. Students create a Venn diagram and label the sorting circles. Students work in cooperative groups to sort...
Curated OER
Solar Flares and Coronal Mass Ejections
In this solar flares and coronal mass ejections worksheet, students create a Venn Diagram with given data about solar flares and Halo CMEs. Students answer 6 questions about the events and the probability of each type of event occurring...
National Security Agency
Are You Game? A Lesson Connecting Fractions and Probability
Exactly how fair are the board games children grow up playing? Young mathematicians investigate this questions as they work their way through this five-lesson series on basic probability.
Curated OER
The Energy that Keeps Us Moving
Students measure the calorie content of food. In this technology lesson, students explore where the CEENBoTs get the energy to make it move. They create a Venn diagram showing the differences of energy in food and CEENBoTs.
Other popular searches
- Sets and Venn Diagrams
- Algebra 1 Venn Diagrams
- Math Venn Diagrams
- Blank Venn Diagrams
- Grade 2 Venn Diagrams
- Venn Diagrams in Math
- Health Venn Diagrams
- Venn Diagrams Logic Problems
- Graphing Math Venn Diagrams
- Sorting Math Venn Diagrams
- Arthropods Venn Diagrams
- Venn Diagrams Math Problems


