Houghton Mifflin Harcourt
Random Samples: Estimating Population
With this estimating populations assignment, your class will learn about taking random population samples and calculating the average number of species in the samples to estimate the total population. Students use the given data to find...
Curated OER
Data Analysis Using Technology
Analyze data using technology. Middle schoolers design data investigations, describe data, and draw their own conclusions. Then they select the best type of graph, graph and interpret the data, and look for patterns in trends. They also...
Curated OER
Valentine Marbles
if you've ever had to guess how many items were in a jar, then this problem is for you! With a big jar full of red and white marbles, does picking a sample of 16 allow your learners to get a good estimate on the percentages of each...
Curated OER
College Athletes
When more basketball players are taller than field hockey players at a school, is it safe to say that in general they are always taller? The activity takes data from two college teams and your learners will be able to answer questions...
Regents Prep
Activity to Show Sample Population and Bias
There is bias in many aspects of our lives, and math is no exception! Learners explore provided data to understand the meaning of biased and random samples. The resource includes various data sets from the same population, and...
American Statistical Association
How Long Are the Words in the Gettysburg Address?
It's 268 words, but one only needs to consider 10 of them at a time. A data collection and analysis activity has learners investigate the lengths of words in the Gettysburg Address. They first self-select a sample of 10 words and...
EngageNY
Understanding Variability When Estimating a Population Proportion
Estimate the proportion in a population using sampling. The 20th installment in a series of 25 introduces how to determine proportions of categorical data within a population. Groups take random samples from a bag of cubes to determine...
US Department of Commerce
Exploring Sampling Variability - Higher Education Attainment Across The United States
More education in statistics is always beneficial. Given cards that provide the proportion of adults with bachelor's degrees in 10 random US states, scholars individually determine the sample percentage of states in which more than 30...
US Department of Commerce
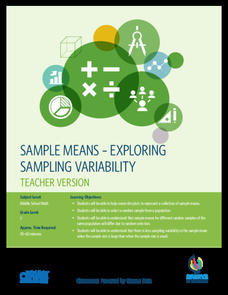
Sample Means - Exploring Sampling Variability
Sample an excellent resource on sampling variability. Pupils analyze census data on the percentage of homes in each state that have Internet access. They take random samples of different sample sizes, determine the sample means, and then...
Discovery Education
Fuss About Dust
Dust is everywhere around us; it's unavoidable. But what exactly is dust and are certain locations dustier than others? These are the questions students try to answer in an interesting scientific investigation. Working independently or...
Curated OER
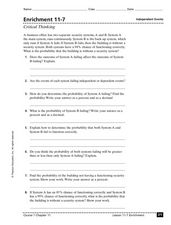
Independent Events
For this independent events probability worksheet, students solve 10 different problems that include determining the probability of certain events described. First, they determine the probability of selecting at random a number divisible...
Curated OER
The Statistics Sampler
Students define sample, describe a random sample, and discuss what compromises a sample. They determine a sample size to estimate a population characteristic with confidence.
Curated OER
Ideas That Lead to Probability
Students explore and define the concept of probability. They utilize a random number generator to determine the fairness of a game. Internet and printable versions fo the activities are included.
Curated OER
Statistics
Seventh and eighth graders solve and complete three various types of problems. First, they find the median rate using the box-and-whisker plot shown. Then, learners describe the inter-quartile range. In addition, they determine whether...
Curated OER
Surveys and Sampling Methods
Math whizzes select the statement that best describes the type of sampling being described. Each of the five problems describes a situation and students are presented with options options. An interactive hint button is provided for each...
Illustrative Mathematics
Robot Races
Analyze data on a graph to answer three questions after a robot race. Learners practice comparing ratios and reading points on a graph. Answers may vary on the last question based on accuracy of graphing. Use the lesson along with three...
PBS
The History and Use of Sampling Methods
Young mathematicians define population, draw convenience sample from the population, draw quota sample from the population, and draw random probability sample from the population. They explain why a random probability sample usually...
Indiana Science
How Many E’s?
Seventh graders explore random sampling by estimating the number of e's on the newspaper. They explain the possible error sources for this type of sampling, and compare the accuracy of sampling a small and large population. This is a...
Curated OER
Sitting across from Each Other
What is the probability that two randomly seated people will be across from each other at a square table? Check learners' understanding of theoretical probability and compound events with this short assessment. A great opportunity to...
Curated OER
Comparative Experiment
In this comparative experiment worksheet, students solve and complete 4 different problems related to conducting the described experiment. First, they explain how they will recruit their participants and discuss whether or not the group...
Curated OER
Random Number Generators And Probability, Will the Wings Win??
Young scholars participate in probability experiments and simulations while modeling and solving problems. They examine how to use the random number generator on a graphing calculator using examples from their local hockey teams.
College Preparatory Mathematics
Geometric Probability
For this geometric probability worksheet, learners solve and complete 12 different problems that include determining the outcomes of various types of probability. First, they use a tree diagram or an area model to compute the desired...
Curated OER
Data Analysis and Froot Loops
Use this probability and graphing lesson to have your learners work with a partner to make a necklace out of Froot Loops. They record the cereal colors randomly chosen and strung, graph their data, then use a ratio formula to determine...
Math Worksheets Land
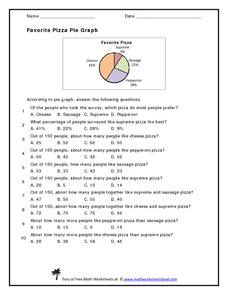
Favorite Pizza Pie Graph
You've heard of a pie graph, but what about a pizza pie graph? Challenge young mathematicians to answer ten questions based on a random survey of people's favorite pizzas. A pie graph displays the percentages of each type of pizza. Some...
Other popular searches
- Random Acts of Kindness
- Random Sampling
- Random Numbers
- Random Mutations
- Random Remainders
- Random Number Generators
- Random Sampling Population
- Random Ballots
- Random Samples
- Random Statistics
- Random Search
- Simple Random Sampling


