Illustrative Mathematics
Setting Goals
Setting financial goals is a common occurrence in middle school that your learners can practice using this activity. They will be able to solve for how many hours Seth needs to work to save up for a skateboard, helmet, and trip. The...
Achieve
False Positives
The test may say you have cancer, but sometimes the test is wrong. The provided task asks learners to analyze cancer statistics for a fictitious town. Given the rate of false positives, they interpret the meaning of this value in the...
Noyce Foundation
Which is Bigger?
To take the longest path, go around—or was that go over? Class members measure scale drawings of a cylindrical vase to find the height and diameter. They calculate the actual height and circumference and determine which is larger.
EngageNY
Part of a Whole as a Percent
Pupils use visual models, numeric methods, and equations to solve percent problems. To complete the second installment of 20, they find the part given the percent and the whole, find the percent given the part and the whole, and find the...
Curated OER
Shots, Standings, and Shopping
Rates and ratios can easily be applied to real-world situations. Learners explore a series of websites in order to procure comparable data. They define ratios and rates, view videos, and use the internet to explore how ratios and rates...
Illustrative Mathematics
Running at a Constant Speed
The learner must use the given constant speed to find the unit rate. A table is made in order to relate the speed to the time and the distance. From the table, learners are able to see the unit rate in miles per minute and miles per...
Virginia Department of Education
Dilation
Open up your pupils' eyes and minds on dilations. Scholars perform dilations on a trapezoid on the coordinate plane. They compare the image to the preimage and develop generalizations about dilations.
Curated OER
The Stained Glass Window
Learners use centimeter rulers and the attached worksheet containing a scale drawing of a stained glass window. The actual measurements of the stained glass window are given, and students are asked to find the actual measurement of the...
Curated OER
Sizing Up the Supersize Croc
Students examine and compare traits of humans and crocodiles. In this crocodile lesson students use a ratio to estimate the height of a person and compare that to a crocodile.
Curated OER
What Do We Do With A Dirty Bomb?
Students examine composition of dirty bomb and its possible effects on a city, and investigate simulations of such an event; students use computational and problem solving skills to assess damage and prepare report proposing solution to...
Curated OER
Metric Olympics
Students participate in a Metric Olympics event and use metric measurements to measure actual performances in their events. They throw a plastic straw for a javelin event, participate in a long jump and high jump event, and a variety of...
Curated OER
Whole Numbers
Student are assigned one of the sections on whole numbers. After reviewing the content, they teach their assigned sections to other class mates. They publish their findings on a PowerPoint slide show to use when they teach their section.
Curated OER
Texas History Math
Seventh graders practice math skills while they become familiar with Texas' Boom & Bust economy and the natural history of the east Texas Piney Woods.
Curated OER
West Nile Virus and Lyme Disease: Making Sense of the Numbers
In an interdisciplinary exploration, trace the development of West Nile fever and Lyme diseases. Pupils discover how these diseases are contracted. They collect statistical data and analyze trends.
Bowland
German or English?
Sprechen sie Deutsch? Future cryptographers must decide whether an unknown text is written in English or in German. They use provided pie charts about the frequency of words in the English and German languages to help make their decisions.
American Statistical Association
Exploring Geometric Probabilities with Buffon’s Coin Problem
Scholars create and perform experiments attempting to answer Buffon's Coin problem. They discover the relationships between geometry and probability, empirical and theoretical probabilities, and area of a circle and square.
Curated OER
Will There be Enough Water?
Students investigate water usage, water available, and water demand historically in the local area. They use projections of water usage, availability and demand up to the year 2050. Students use graphs to relate as well as compare and...
Curated OER
Water - Planning for the Future
Students explore and examine the increases and/or decreases for water user groups: irrigation, municipal, manufacturing, steam electric power generation cooling, livestock, and mining. They utilize percentage changes during their...
Curated OER
The Circle Graph
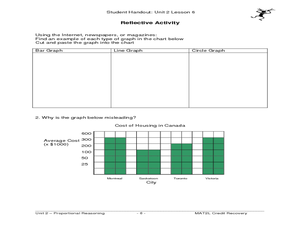
In this circle graph learning exercise, students complete problems involving many circle graphs including a compass rose, degrees, and more. Students complete 7 activities.
Curated OER
Are you in Golden Shape
Students solve and verify the solution for unknown measures. In this geometry lesson, students identify the properties of circles. They use the arc, angle and segment relationship to find the missing measures.
Curated OER
TIMS, The Bouncing Ball: Math, Science, Measurement, Graphs, Variables
Learners determine the exact relationship between the height from which a ball is dropped and the distance that it rebounds.
Curated OER
Aldridge Sawmill - The Story in Numbers
Seventh graders practice math skills while becoming familiar with Texas' "Boom & Bust" economy and the natural history of the east Texas Piney Woods. After researching the Aldridge Sawmill, 7th graders utilize a worksheet imbedded in...
Curated OER
The Greatest Survival Story of All Time
Students use the Internet to read about an explorer's survival in the Antarctic. They try to find a better route for him to have taken.
Curated OER
Count on Math
Students develop number sense up to a million. In this developing number sense up to a million instructional activity, students count their breaths in given time span. Students use blocks representing 10's and 100's to create a...


