Alabama Learning Exchange
Probability with Tree Diagrams
Middle school math whizzes view a PowerPoint tutorial on tree diagrams. Using "Anthonio's Pizza Palace," an interactive activity involving the selection of pizza toppings, they use Pascal's triangle as a tree diagram. This is an engaging...
Curated OER
Probability: the Study of Chance
Students experiment to determine if a game is fair, collect data, interpret data, display data, and state and apply the rule for probability. Students use a simple game for this experiment.
Curated OER
Study of Chance
Seventh graders determine the fairness of various games. In this determining the fairness of various games lesson, 7th graders use spinners, dice, and rock,paper, scissors to play various chance games. Students determine if each game...
Virginia Department of Education
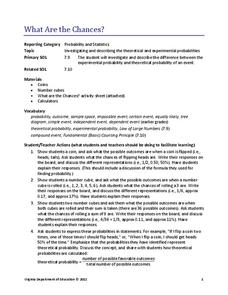
What Are the Chances?
Take a chance on an informative resource. Scholars conduct probability experiments involving coins and number cubes to generate data. Compiling class data helps connect experimental probability to theoretical probability.
Virginia Department of Education
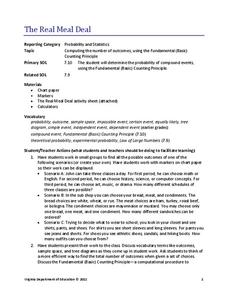
The Real Meal Deal
Burgers and salads and sodas, oh my! Scholars use a menu to investigate the Fundamental Counting Principle. They create tree diagrams to illustrate the number of possible choices for each given scenario.
Curated OER
Counting Principle
In this counting principle worksheet, students find the possibility of an event while using the counting principle. They read about this tool to find the total number of combinations.
Curated OER
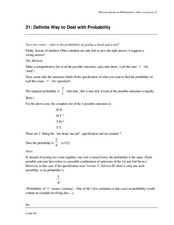
Misconceptions in Mathematics: Misconception 21
In this mathematics misconceptions instructional activity, students examine examples of math mistakes pertaining to probability and explore the reasons that the examples are incorrect.
Curated OER
Chances Are...
Students examine the probability of an event. In this probability lesson, students determine whether it is likely that an event will occur in coin flipping activities. They work with two and four coins, and one die in three different...
Curated OER
Take a Chance
Students explore possible outcomes and impossible events. They determine if an event is likely or unlikely. Students investigate the possible outcomes of events and they record the outcomes. Students discuss their answers and use...
Curated OER
What Are The Odds?
Students read the book, Jim Ugly, and discuss whether the odds were in favor of or against the character Jake finding his dad. They demonstrate an experiment involving odds by keeping a tally of how many times a colored die is pulled out...
Curated OER
Coyote Cafe
In this math worksheet, students read the word problems and write down the possibilities of possible servings. The outcomes are plotted using a graphic organizer.
Curated OER
Sitting across from Each Other
What is the probability that two randomly seated people will be across from each other at a square table? Check learners' understanding of theoretical probability and compound events with this short assessment. A great opportunity to...
Curated OER
Probability
In this math literacy worksheet, middle schoolers solve the four problems related to the concept of probability using the multiple choice format.
Curated OER
Drawing Conclusions
Students play a probability game, then design and complete a probability problem concerning changing odds.
Curated OER
Permutations
In this math worksheet, students read about the concept of permutations. They arrange the objects in a certain order and think of the possible combinations.
PBS
Remove One
With a set of 15 chips and a number line, learners predict what sums may occur with the rolling of two dice. When their sum comes up, they remove one of the chips from their number line with the objective of being the first to remove...
Curated OER
Lara's Equiprobable Dice
Students try some new exercises involving probability. These are, first of all, that the probability of getting a given total when two dice are rolled is equal to the number of possible ways of getting that total, divided by 36 (the...
Curated OER
Plum Stone Dice Game
Students read about a Native American dice game online. They make replica games, and practice playing with them. They predict the outcome of the dice rolls by completing a dice throw chart.
Mathematics Assessment Project
Spinner Bingo
Learners are in it to win it for a fun math activity! After comparing Bingo boards to figure out which one is most likely to win, individuals then determine the numbers to choose in order to create a board with the best chance of winning.
Curated OER
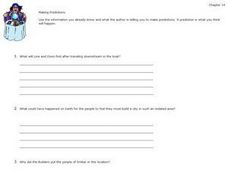
Making Predictions
Students explore the concept of probabiility and outcome through several decision making activities. Making accurate predictions in daily life including weather forecasting, stock market selections, or job changes are all dependent on...
Curated OER
Counting Principle
In this probability and statistics worksheet, students work with a family member to determine the number of outcomes in a given situation. The two page worksheet contains four questions. Answers are included.
Curated OER
What Are the Risks?
Middle schoolers use dice to determine the risk of being exposed to radon. They practice using new vocabulary related to probability and ratios. They make predictions about the results and record their observations.
Curated OER
Interpreting Graphs
Sixth graders interpret linear and nonlinear graphs. They create graphs based on a problem set. Next, they represent quantitive relationships on a graph and write a story related to graphing.
Curated OER
Figuring Elapsed Time
Students discover the concept of elapsed time. In this calculating time lesson, students utilize the Internet to complete record sheets based on the concept of elapsed time. Finally, the students answer questions on their own.


