Curated OER
Interpreting Graphs
Students investigate graphs. In this graphing lesson plan, students create a graph regarding the population of California. Students extrapolate answers concerning the data set.
Curated OER
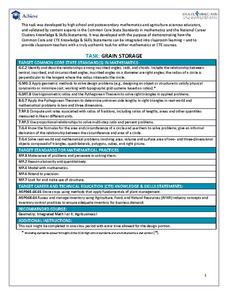
Task: Grain Storage
Farming is full of mathematics, and it provides numerous real-world examples for young mathematicians to study. Here, we look at a cylinder-shaped storage silo that has one flat side. Given certain dimensions, students need to determine...
Annenberg Foundation
Geometry 3D Shapes: Euler's Theorem
How do you get a theorem named after you? Euler knows what it takes! The third lesson of five asks pupils to use an interactive activity to compare the faces, vertices, and edges of seven different three-dimensional solids. They use...
Teach Engineering
Let's Learn About Spatial Viz!
Can you see your class working on spatial visualization? The first installment of a five-part module introduces the concept of spatial visualization and provides a 12-question diagnostic assessment to test spatial visualization skills....
Achieve
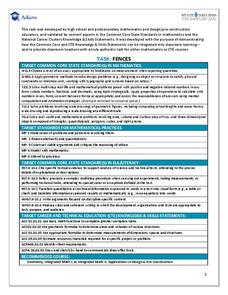
Fences
Pupils design a fence for a backyard pool. Scholars develop a fence design based on given constraints, determine the amount of material they need, and calculate the cost of the project.
American Statistical Association
Exploring Geometric Probabilities with Buffon’s Coin Problem
Scholars create and perform experiments attempting to answer Buffon's Coin problem. They discover the relationships between geometry and probability, empirical and theoretical probabilities, and area of a circle and square.
Curated OER
Anything I Can Do You Can Do Better
Students complete a two-week unit involving design and construction concepts. They watch a PowerPoint presentation about geometric shapes, draw the fourteen shapes incorporated in bridge construction, and in small groups design, build,...
Curated OER
Skateboard Flex
Students examine statistics by completing a skateboard measuring activity. In this flex lesson plan, students define what skateboard "flex" refers to and identify the proper method of measuring flex by conducting an experiment with...
Curated OER
Make Your Own "Weather" Map
Young scholars develop and apply a variety of strategies to solve problems, with an emphasis on multi-step and non-routine problems. They acquire confidence in using mathematics meaningfully.


