Curated OER
Integers and the Number Line
In this integers and number line activity, students complete 10 problems by naming the set graphed. Students graph 6 number sets. Then students answer 6 sum problems.
Curated OER
Integers and the Number Line
In this integer and number line worksheet, students in 6 problems name the graphed set of numbers. Students then graph 8 number sets.
Curated OER
Interpreting Data and Statistics using Graphs
Seventh graders interpret data. In this lesson on types of graphs, 7th graders construct, interpret, and analyze different graphs. This lesson includes worksheets and resources.
Illustrative Mathematics
The Intersection of Two Lines
Here is an introduction to solving simultaneous linear equations. Start by drawing a line through two points. Create a second line which goes through the intersecting point. Background knowledge of how to find the equation of a line and...
Curated OER
Line of Best Fit
In this line of best fit worksheet, students solve and complete 8 different problems that include plotting and creating their own lines of best fit on a graph. First, they study the samples at the top and plot the ordered pairs given on...
Curated OER
Introduction to Graphs: Bar Graphs, Line Graphs, Circle Graphs
For this graphing data worksheet, middle schoolers answer 5 short answer questions about graphs. Students determine which type of graph best represents various data sets.
Curated OER
Creating Line Graphs
Learners relate data to coordinate graphs and plot points on this graph. They use minimum wage data to construct the graph. Students decide appropriate time intervals for the graphs. They share graphs with their classmates.
Curated OER
Functions and Graphing
Graphing functions in a real world application makes math come to life. Learners graph points on a coordinate plane and identify various points on a graph by working through a set of real world problems. This is a perfect review exercise.
Curated OER
Interval Notation and Linear Inequalities
In this interval notation and linear inequalities worksheet, students use number lines and solve equations. Students complete 64 problems total.
Curated OER
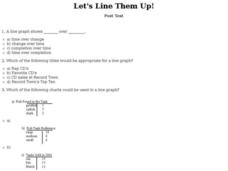
Let's Line Them Up! Post Test
In this line graphs worksheet, learners answer multiple choice questions about line graphs. Students complete 10 multiple choice questions.
Houghton Mifflin Harcourt
Intensive Math
Three chapters worth of integer, fraction, and decimal problems to give you every type of question your learners need to be a successful mathematician. Thankfully the work has been done for you and this is a huge resource full of...
Illustrative Mathematics
Walk-a-thon 1
Your mathematician's job is to explore the relationship between hours and miles walked during a walk-a-thon. The activity compels your learners to experiment with different means in finding out this proportional relationship. The answer...
Illustrative Mathematics
Puzzle Times
Give your mathematicians this set of data and have them create a dot plot, then find mean and median. They are asked to question the values of the mean and median and decide why they are not equal. Have learners write their answers or...
EngageNY
Finding One Hundred Percent Given Another Percent
Class members solve problems to find the whole when given a percent. They use double line numbers and factors of hundred to help break the 100 percent into equal segments.
CK-12 Foundation
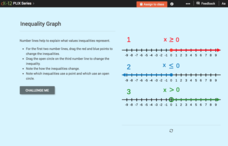
Inequality Expressions: Inequality Graph
Don't let inequalities be a drag. As young mathematicians drag the endpoint of the graph of an inequality in an interactive, the algebraic form of the inequality changes. This helps them see how the graph connects to the inequality.
Curated OER
Frequency, Histograms, Bar Graphs and Tables
In this frequency instructional activity, students interpret histograms, bar graphs and tables. They examine frequency charts and comparison line graphs. This three-page instructional activity contains 4 problems. Answers are provided...
Curated OER
Quiz: Reading and Making Line Plots
In this reading and making line plots worksheet, students create a line plot for given sets of numbers. In addition, they read graphs and interpret the average. This one-page worksheet contains ten problems.
Curated OER
Introduction to Representing and Analyzing Data
Represent data graphically. Allow your class to explore different methods of representing data. They create foldables, sing songs, and play a dice game to reinforce the measures of central tendency.
Curated OER
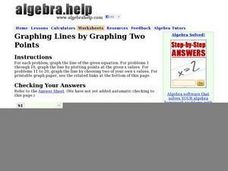
Graphing Lines by Graphing Two Points
Use a graphing lines worksheet to have your mathematicians graph the line of a given equation and plot specified points. The first 10 problems have a given equation, and two values. The next 10 problems have a given equation, but your...
Education Development Center
Geography of the Coordinate Plane
Put the graph into graphing and allow learners to understand the concept of point plotting and how it relates to data. The worksheet provides a nice way to connect data analysis to a graph and make predictions. The worksheets within the...
Curated OER
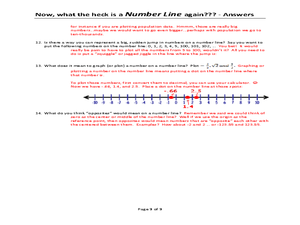
Now, what the heck is a NUMBER LINE again???
A unique approach to reviewing number lines and how to locate different values on them, this worksheet poses several questions that require written answers rather than calculations. You could use this as a note-taking guide when teaching...
Curated OER
Line Graphs
Seventh graders create a line graph and identify when to use line graphs. In this line graphs lesson, 7th graders analyze the average temperatures of various cities. Students graph the data they collected.
Illustrative Mathematics
Two Lines
Here is a resource that helps your algebra learners understand the connection between the graph of two lines, the equations of lines, and the solutions and intersecting points of lines. It would make a great assessment question, but can...
Curated OER
Fire!, Probability, and Chaos
Upper elementary and middle schoolers work with the concept of probability. They are introduced to the concept of chaos. Learners graph and analyze using a line plot, work with mean, and are introduced to the concept of variance.


