Curated OER
Build a Skittles Graph
Students construct a bar graph with a given set of data. They calculate the ratio and percent of the data. Students discuss alternate ways of graphing the data as well as multiple strategies to approach the task.
Curated OER
Buying on Credit
Students determine how buying on credit adds to the total cost of an item by computing the interest. They find a major item advertised in a magazine and identify the price. Then they identify the rate of a credit card and calculate the...
Curated OER
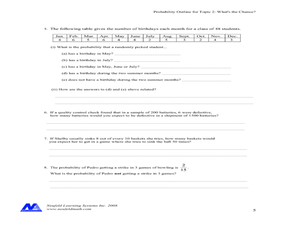
Concept: What's The Chance?
In this concept worksheet, students perform probability experiments. Using collected information, they interpret the data. Students answer questions about probability. This five-page worksheet contains approximately 15 multi-step...
Curated OER
ACC Basketball Statistics
Middle schoolers use math skills and create a spreadsheet. In this statistics and computer skills lesson, students gather ACC basketball statistics, convert fractions to decimals and then percents. Middle schoolers use the gathered...
Curated OER
Naming Geometric Shapes
Name that shape! This simple worksheet has learners identify each geometric figure. They examine rectangular prisms, cylinders, rectangular pyramids, and hexagonal prisms. This one-page worksheet contains 8 problems, and the goals seems...
Curated OER
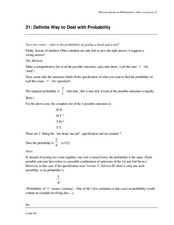
Misconceptions in Mathematics: Misconception 21
In this mathematics misconceptions instructional activity, students examine examples of math mistakes pertaining to probability and explore the reasons that the examples are incorrect.
Curated OER
Chances Are...
Students examine the probability of an event. In this probability lesson, students determine whether it is likely that an event will occur in coin flipping activities. They work with two and four coins, and one die in three different...
Curated OER
A Christmas Project
Seventh graders publish a letter and spreadsheet using the computer. They build a three-dimesnsional object with construction paper and develop a Christmas object using coordinates on a graph. Students compose a response in their journals.
Curated OER
Chart the Stars
Seventh graders find constellation distances and plot the stars. In this star lesson, 7th graders plot the star points for Canis Major. Students use graphing calculators to graph the constellation. Students choose another constellation...
Curated OER
Using Probability
For this probability worksheet, students complete probability word problems about rolling dice. Students complete 9 problems total.
Curated OER
Careers in Science Lesson Three
Students explore the types of careers that they study of science subjects can lead to. They are introduced to the lesson with the statement as: Today we are looking at a variety of occupations that the study of chemistriy, mathematics...
Curated OER
Patterns, Functions & Algebra
Students participate in numerous activities and games. In pairs, they play card games to find relationships between a random set of playing cards. After writing samples of Dear Abby letters concerning math problems, students create a...
Helping with Math
Using Integers
Given nine clues, investigators write down a positive or negative integer that represents the scenario. Then they compare pairs of integers and identify which is less or which is greater according to specified directions. This is a...
Curated OER
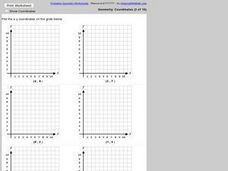
Plot the x-y Coordinates on the Grids Below
In this coordinate grid graphing worksheet, students plot the given points onto each of 6 coordinate grids. All points are located in quadrant 1. One point is plotted on each grid. Answers are given by clicking the appropriate place on...
Curated OER
Geometry: Calculating Volumes
In this volume learning exercise, middle schoolers find the volume of 8 prisms. Students are given the length, width, and height of each prism.
Curated OER
Plotting Coordinates on a Grid
In this plotting points on a graph activity, students plot 6 points on 6 graphs. Students plot x and y-coordinates in the first quadrant.
Curated OER
Geometry Worksheet: Pythagoras' Theorem
In this Pythagorean Theorem activity, students use the Pythagorean Theorem to find the length of the unlabeled side of the right triangle. There are 8 problems all together.
Curated OER
Subtraction: Decimals
In this decimal subtraction worksheet, students solve 15 problems that require them to subtract decimal numbers with 1-5 digits.
Curated OER
Addition - Decimals
In this decimal addition worksheet, students solve 15 problems that require them to add decimal numbers with 1-5 digits.
Curated OER
Problem Solving: Steps and Strategies
Students explore the concept of problem solving strategies. In this problem solving strategies lesson, students discuss methods for solving problems such as re-reading a problem, stating the facts, drawing a picture and so on. Students...
Curated OER
An Introduction to Elementary Statistics
Students explain and appreciate the use of statistics in everyday life. They define basic terms used in statistics and compute simple measures of central tendency.
Curated OER
Unexpected Answers
Students consider probability problems with unexpected and surprising answers.
Curated OER
Traffic Light Probability
Students discuss the possible traffic signals that may be observed on the way to a field trip. They record data on the trip, and analyze the probability of the results occurring again.
Curated OER
Finding Mean, Mode and Median in the Computer Lab
Young scholars create spreadsheets which will display and figure mean, median, and mode of a set of numbers.


