Curated OER
The Mandelbrot Set
Students explore the Mandelbrot Set. They are introduced to the concept of a complex number and function in order to motivate the discussion of Julia and Mandelbrot sets. Students investigate fractals and how they are built.
Curated OER
Code Breakers
Students collect data and make a frequency table, change ratios into percents, and analyze data to make predictions.
Curated OER
Impossible Graphs
Pupils distinguish between possible and impossible graphs of functions, and to learn why some graphs are impossible. They have practiced plotting functions on the Cartesian coordinate plane
Curated OER
Graphing the Daily Revenue of Miami Seaquarium
Seventh graders compile a table of the revenues of the 8 eateries (a combined total), Main Gate admissions, and the Gift Shop.
Curated OER
Rescue the Pattern
Students describe a wide variety of patterns. They extend a wide variety of patterns. Students write rules for a wide variety of patterns. Students represent, analyze, and generalize a variety of patterns with tables, graphs, and words.
Virginia Department of Education
Middle School Mathematics Vocabulary Word Wall Cards
Having a good working knowledge of math vocabulary is so important for learners as they progress through different levels of mathematical learning. Here is 125 pages worth of wonderfully constructed vocabulary and concept review cards....
Curated OER
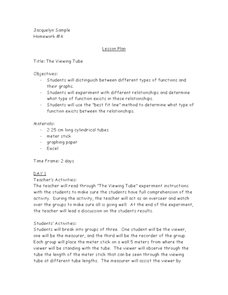
The Viewing Tube
Looking for an excellent instructional activity that incorporates math, science, and technology? Groups of three students use a viewing tube to perform an experiment, and discover how to organize their data into an Excel spreadsheet. ...
101 Questions
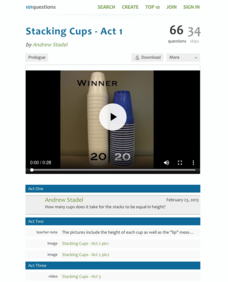
Stacking Cups
Facilitate an understanding of equality using a modeling task. After watching different-sized cups being stacked, learners use their math skills to determine when the height of each cup tower will be the same. Meant as an introduction to...
Illustrative Mathematics
Find the Change
This exercise is an opportunity for algebra learners to understand the connection between the slope of a line and points found on the line. Use similar triangles to explain why slope m is the same between any two points. Discuss with the...
Shodor Education Foundation
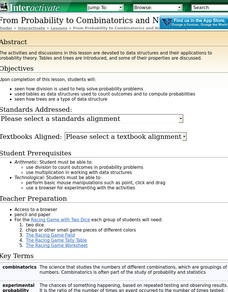
From Probability to Combinatorics and Number Theory
What middle schooler does not enjoy an occasional online game? In this lesson play, you will find embedded links to an online probability game, and informative pages about how division is used in probability, the concept of tree models,...
Curated OER
Clinometer
Seventh graders build their own Clinometer and using the tangent of angles, estimate the height of trees. Then these students develop and instructional activity to show whole class and determine the tallest tree on school property.
Noyce Foundation
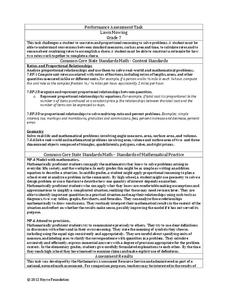
Lawn Mowing
This is how long we mow the lawn together. The assessment requires the class to work with combining ratios and proportional reasoning. Pupils determine the unit rate of mowers and calculate the time required to mow a lawn if they work...
California Education Partners
Speedy Texting
Model the effects of practice on texting speed. Pupils develop a linear equation that models the change in texting speed based on the amount of practice. The sixth performance task in an eight-part series requires learners to solve and...
Concord Consortium
Center of Population
Let the resource take center stage in a lesson on population density. Scholars use provided historical data on the center of the US population to see how it shifted over time. They plot the data on a spreadsheet to look the speed of its...
Curated OER
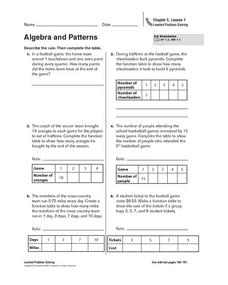
Algebra and Patterns
In this algebra and patterns practice worksheet, students sharpen their problem solving skills as they solve 6 story problems.
Virginia Department of Education
Relationships Round Robin
Mathematics is all about patterns. Young mathematicians analyze geometric patterns to write algebraic expressions. They use the expressions to predict future stages of the patterns.
Curated OER
Virtual Field Trip
This hands-on resource has future trip planners analyze graphs of mileage, gasoline costs, and travel time on different routes. While this was originally designed for a problem-solving exercise using a Michigan map, it could be used as a...
Curated OER
Play It
There are a number of activities here that look at representing data in different ways. One activity, has young data analysts conduct a class survey regarding a new radio station, summarize a data set, and use central tendencies to...
Curated OER
Adding and Subtracting Algebraic Expressions (Combining Like Terms)
Everyone loves math when it includes food! This activity tries to take the notion of combining like terms in algebra and comparing it to sorting apples and oranges. It takes a step-by-step approach to helping students understand this...
Curated OER
Box Plots
Young statisticians are introduced to box plots and quartiles. They use an activity and discussion with supplemental exercises to help them explore how data can be graphically represented.
Curated OER
Interpreting and Displaying Sets of Data
Students explore the concept of interpreting data. In this interpreting data lesson, students make a line plot of themselves according to the number of cubes they can hold in their hand. Students create their own data to graph and...
Curated OER
Graphs and Data
Students investigate poverty using graphs. In this algebra instructional activity, students collect data on the effects of poverty and use different rules to analyze the data. They graph and use the trapezoid rule to interpret the data.
Curated OER
Introduction to Statistics: Mean, Median, and Mode
Students explore the concepts of mean, median, and mode. They develop an understanding and familiarity with these concepts. Students explore mean and median in an efficient way. Students explore three different measures of center.
Curated OER
Fire!, Probability, and Chaos
Upper elementary and middle schoolers work with the concept of probability. They are introduced to the concept of chaos. Learners graph and analyze using a line plot, work with mean, and are introduced to the concept of variance.
Other popular searches
- Function Tables 5th Grade
- Function Tables and Graphs
- Algebra Function Tables
- Function Tables Word Problems
- Linear Function Tables
- Patterns and Function Tables
- Graph Function Tables
- Math Function Tables
- Function Tables and Algebra
- Nd Function Tables
- Graphing Function Tables
- Function Tables Ell


