Curated OER
Gold Rush California and its Diverse Population
Young scholars compare contemporary cultural differences with historical differences based on population percentage. In this cross-curriculum Gold Rush/math lesson, students analyze aspects of California's Gold Rush population and...
Curated OER
Working with Percentages and Proportions
In this percentages and proportions instructional activity, students are given percentages, they express them as a proportions, they create an equivalent ratio using "x" for the unknown portion and they cross multiply and divide to find...
Shodor Education Foundation
Estimating With Fire
Watch the damage from a forest fire in this interactive simulation activity that challenges learners to estimate the burn area using different approaches. Learners are given a worksheet to track the different burn patterns and practice...
Curated OER
Interest Rates
Use a KWL chart and discussion to explore the concept behind loans with interest based on percentage rates. Learners examine different types of interest, the history of interest loans and calculate the costs of a loan over a ten-year...
Curated OER
Problem Solving Decisions: Choose a Method
Walk your scholars through the process of finding percentages using this problem-solving worksheet! A word problem asks students to figure out how many pieces of a puzzle are left, if the completed 750 pieces make up 60% of the total....
Curated OER
The Stock Market
Students explore the loss and gain made in the stock market as they invest a sum of money and report the results as percentages instead of points.
EngageNY
Changing Scales
Pupils determine scale factors from one figure to another and the scale factor in the reverse direction. Scholars compute the percent changes between three figures.
Noyce Foundation
Mixing Paints
Let's paint the town equal parts yellow and violet, or simply brown. Pupils calculate the amount of blue and red paint needed to make six quarts of brown paint. Individuals then explain how they determined the percentage of the brown...
Curated OER
Store Wide Sale
Young scholars practice figuring percentages by solving written shopping problems. In this consumer math lesson, students read several scenarios dealing with items on sale and must figure out the new price. Young scholars check their...
Mathematics Assessment Project
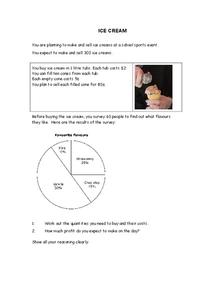
Ice Cream
I scream, you scream, we all determine the amount of ice cream! Pupils calculate the amount of ice cream flavors needed based on survey results in a short summative assessment. They determine the number of tubs and cost of ice cream to...
Curated OER
Averages and Percentages
For this averages and percents worksheet, learners identify and define average as all numbers together divided by the total number of items added. Then they identify and define percent as the given number out of a total possible....
Curated OER
The World in a Classroom
Students calculate percentages of different kinds of people in the world. In this diversity lesson plan, students will see the percentages of different people and different incomes based on if the world only had 100 people in it.
Curated OER
7th Grade Math Circle Graphs
Seventh graders are able to develop (synthesis) pie graphs with the class and on their own. They are told that pie charts are a graphic representation of material that can be given in the form of parts of a whole by using...
Curated OER
Percent Box
Learners examine the procedures to determine a number when the percentage of the whole is known or to find the whole number when the part or percentage is known.
Curated OER
Measuring the Area of a Circle
When mathematical errors happen, part of the learning is to figure out how it affects the rest of your calculations. The activity has your mathematicians solving for the area of a circular pipe and taking into consideration any errors...
Illustrative Mathematics
Anna in D.C.
The amount of tax and tip on a restaurant bill is a common example used in percent problems. Here, learners only know the total amount paid, and they need to figure the itemized amounts. Solutions using a ratio table, using knowledge of...
Curated OER
Decimals, Percents, and Fractions
Learners practice converting fractions, decimals, and percentages to communicate equal amounts. They fill in a table, determine the percentage of a total area that is shaded in diagrams, complete equations with decimals to the hundredths...
Illustrative Mathematics
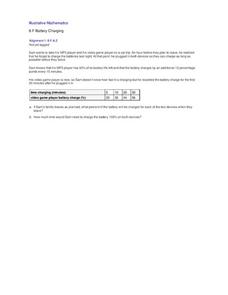
Battery Charging
Your class will be very interested in the results of this activity. How long does it take a MP3 and video game player to charge? Sam only has an hour and the MP3 player only has 40% of its battery life left. Plus, his video player is...
Illustrative Mathematics
Area of a Trapezoid
Here is a straightforward example of how to apply the Pythagorean Theorem to find an unknown side-length of a trapezoid. Commentary gives additional information on proving that the inside of the trapezoid is a rectangle, but is...
Curated OER
Mathematical Magazines
Students look through magazines and calculate the percentages of the types of ads in the magazines. For this percentages lesson plan, students create a graph to show their results.
Helping with Math
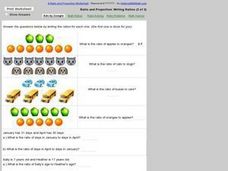
Ratio and Proportion: Writing Ratios (2 of 2)
Elementary and middle schoolers use pictures to figure out simple ratios and complete ratio word problems. An example is done for learners in which three apples and seven oranges are displayed. The answer simply is a ratio of 3:7. The...
Curated OER
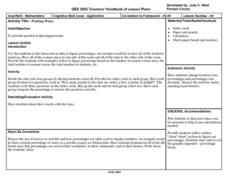
Parting Ways
Students become part of the solution as they practice figuring percents. The number of men versus women present in the room and their heights can be used to form the basis of this investigation.
Curated OER
Dog Salmon Lesson Two
Students identify the inside parts of a dog salmon in English and Athabascan. They weigh each part of the salmon and determine the percentage of the whole that the part represents.
Curated OER
Play Ball
Students calculate baseball statistics and ball field dimensions. In this Pythagorean Theorem, percentages and metric conversion lesson, students are given formulas to find earned run and batting averages for White Sox baseball players....


