Curated OER
Daily Time Ratios
Students track and record how much time they spend on each activity. In this spreadsheet instructional activity, students apply different functions using Microsoft excel to format cells and calculate the sum of their total time spent...
101 Questions
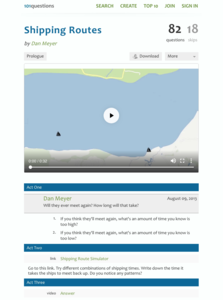
Shipping Routes
The product of the hard work is learning. Scholars use a simulation tool to collect information to analyze. They must decide when two ships traveling back and forth across a river at different rates will meet on the same side. The intent...
Curated OER
Activity: An Experiment with Dice
Roll the dice with this activity and teach young mathematicians about probability. Record outcomes for rolling two number cubes in order to determine what is most likely to happen. Graph the data and investigate patterns in the results,...
Alabama Learning Exchange
How Big Can a Bee Be?
Mathematicians analyze the relationships between surface area and volume. They conduct Internet research, conduct various experiments, record the data in a spreadsheet, and graph the results and compare the rate of increase of surface...
Curated OER
Froot Loops to the Max - 3
Learners complete and solve five questions/problems related to a box of Froot Loops cereal. First, they determine how many of each color of Froot Loops are in the box. Then, pupils determine which color had the greatest frequency and...
Curated OER
Froot Loop Favorites
In this Froot Loop favorites worksheet, students solve and complete 3 different problems that include data tables related to their Froot Loop favorites. First, they determine what fraction of the class voted for each color listed in the...
Utah Education Network (UEN)
Linear Relationships: Tables, Equations, and Graphs
Pupils explore the concept of linear relationships. They discuss real-world examples of independent and dependent relationships. In addition, they use tables, graphs, and equations to represent linear relationships. They also use ordered...
Curated OER
Birds' Eggs
More than just data, scatter plots are full of information that can be used to answer a variety of questions. This lesson uses a plot with information about bird egg sizes to answer questions about the relationship between length and...
Achieve
False Positives
The test may say you have cancer, but sometimes the test is wrong. The provided task asks learners to analyze cancer statistics for a fictitious town. Given the rate of false positives, they interpret the meaning of this value in the...
Curated OER
Population Ratios
Young scholars access web site and record various population statistics pertaining to a county in the USA of their choice. They use this data to set up and solve ratios. They compare data to make meaning of the numbers.
Curated OER
Atlatl Lessons Grade 4-12
Students experiment with velocity, ratios, and rates. In this data management lesson plan, students throw a dart with and without using an atlatl and collect and record various data. Students construct ratios based on the data and...
Curated OER
Jazz and Math: The Beat Goes On
Students collect real data through listening, counting and timing jazz pieces.They use ratios, rates, and proportions to report collected data and demonstrate an understanding of the concepts of rhythm and tempo in music.
Mathematics Assessment Project
Middle School Mathematics Test 4
Raise expectations in your classroom and assess learners through the provided performance tasks. Class members must apply concepts learned throughout the year, providing a good measurement of how well they understand the material. The...
Math Drills
Trick-Or-Treat Candy Probabilities
Class members satisfy their sweet tooth with a Halloween-themed, candy probability worksheet. Using images of candy pieces that represent data, young mathematicians find the probability of getting different pieces of candy while...
California Education Partners
Animals of Rhomaar
Investigate the growth rates of alien animals. Pupils study fictional animals from another planet to determine how much they grow per year. The investigators plot the growth of their animals over a period of time and then compare them to...
Curated OER
Baseball Relationships - Using Scatter Plots
Students use graphing calculators to create scatter plots of given baseball data. They also determine percentages and ratios, slope, y-intercepts, etc. all using baseball data and statistics.
Curated OER
As Good As Gold
Students find examples of the Golden Ratio on the human body through measurement. Additionally, students learn about the use of the Golden Ratio and the Golden Rectangle in art and architecture. A very interesting lesson plan for the...
Curated OER
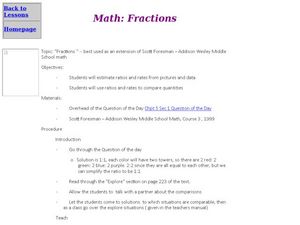
Math: Fractions
Participate in a class instructional activity on ratio, rate, and unit rate. Successful usage of this instructional activity requires the pupils and the teacher have access to the Scott Foresman/Addison Wesley Middle School math text....
Curated OER
Word Problem Practice Workbook
Need worksheets that challenge your middle schoolers to apply their understanding of math? Problem solved! From integers, fractions, and percents, to algebra, geometry, and probability, over 100 pages of word problem worksheets are...
Curated OER
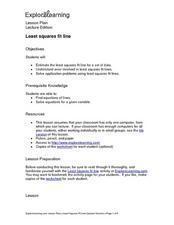
Least Squares Fit Line
Practice makes perfect! Learners estimate the least squares fit line for a set of data. They understand error involved in least squares fit lines, and solve application problems using least square fit lines.
Curated OER
Baseball Stats
Middle schoolers explore data sheets and statistics in baseball. They use baseball data available on the Internet to develop an understanding of the different ways in which data can be analyzed.
Curated OER
Taste the Rainbow
Students practice estimating and graphing by utilizing Skittles. In this statistics lesson, students complete worksheets based on the likelihood of a certain color of skittle coming out of the bag. Students create a graph based on the...
Curated OER
Ratio Basketball
Students, in teams of four, practice shooting free throws while mentally converting the ratio of shots made to those thrown into a percent. They chart and record the ratio, decimal and actual percentage earned after each round.
Curated OER
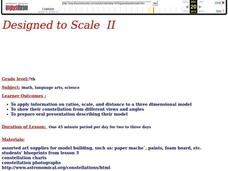
Designed to Scale
Seventh graders study ratios, scale and distances according to a three dimensional model. In this exploratory lesson students create their own constellation and prepare an oral presentation that describes their model.


