Curated OER
Making a Circle Graph of a Sample Budget
Students examine a sample budget and categorize the entries as a group. Then in small groups they convert budget category totals to percents and degrees to make a circle graph related to a sample budget.
Curated OER
Circle Graphs and Percents
In this circle graph and percentages worksheet, learners fill in a chart, write percentages, calculate discounts, and more. Students complete 4 sets of problems.
Curated OER
Creating Circles
Students make a circle graph. In this graphing lesson plan, the teacher conducts a class survey, then demonstrates how to make a pie graph. When students are comfortable with the material, they use a worksheet to create their own graph.
Curated OER
Choose an Appropriate Graph
In this graphs worksheet, students solve 6 fill in the blank problems where they choose the most appropriate type of graph for each set of data and explain why they chose that type. Students use bar graphs, histograms and circle graphs....
Curated OER
Leveled Problem Solving: Circle Graphs
In this circle graphs worksheet, learners solve 6 word problems based on a circle graph about the most popular classes for sixth graders. Students calculate angle measures of circles for 2 of the problems.
Curated OER
A Picture is Worth a Thousand Words: Introduction to Graphing
Students practice graphing activities. In this graphing lesson plan, students discuss ways to collect data and complete survey activities. Students visit a table and graphs website and then a create a graph website to practice graphing.
Curated OER
Making Circle Graphs
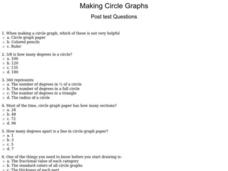
In this circle graphs worksheet, students answer multiple choice questions about how to make circle graphs. Students answer 10 questions total.
Curated OER
The Circle Graph
In this circle graph instructional activity, students complete problems involving many circle graphs including a compass rose, degrees, and more. Students complete 7 activities.
Curated OER
Pizza Possibilities
Students create and interpret line plots, bar graphs, and circle graphs. The instructional activity assumes mastery of conversions from fraction to decimal to percent, construction of angles, and at least an introduction to graphs...
CK-12 Foundation
Displaying Categorical Variables: Spending Habits
Bar or circle graph—which is best? Given a circle graph and a total amount of money earned, pupils calculate the amount of money in each category. Learners use the calculated amounts to create a bar graph and compare the two displays.
Curated OER
Play It
There are a number of activities here that look at representing data in different ways. One activity, has young data analysts conduct a class survey regarding a new radio station, summarize a data set, and use central tendencies to...
Curated OER
Graph It!
There is more than one way to represent data! Learners explore ways to represent data. They examine stacked graphs, histograms, and line plots. They conduct surveys and use stacked graphs, histograms, or line plots to chart the data they...
Curated OER
Holiday Greeting Cards: A Graphing Activity
Students examine statistics about the popular type of greeting cards and create pie or bar chart using an online tool. They illustrate the sales statistics for the greeting cards before making the charts.
Curated OER
7th Grade Math Circle Graphs
Seventh graders are able to develop (synthesis) pie graphs with the class and on their own. They are told that pie charts are a graphic representation of material that can be given in the form of parts of a whole by using...
Curated OER
Introduction to Graphs: Bar Graphs, Line Graphs, Circle Graphs
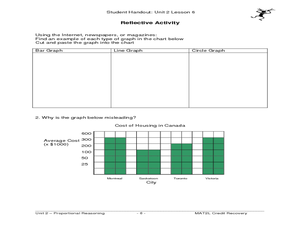
In this graphing data worksheet, learners answer 5 short answer questions about graphs. Students determine which type of graph best represents various data sets.
Curated OER
Introduction to Representing and Analyzing Data
Represent data graphically. Allow your class to explore different methods of representing data. They create foldables, sing songs, and play a dice game to reinforce the measures of central tendency.
Curated OER
Data Analysis and Probability
Students make their own puzzle grid that illustrates the number of sit-ups students in a gym class did in one minute, then they make a histogram for this same data. Then they title their graph and label the scales and axes and graph the...
Curated OER
What's in a Number? Analyzing Smoking Statistics
Sixth and seventh graders analyze smoking statistics. In this health lesson plan, learners look at the percentage of people who smoke from each race group. They create a bar graph and circle graph that displays this information.
Pace University
Grade 7 Earth Day Statistics with Circle and Bar Graphs
Take a tiered approach to studying waste. The lesson plan uses Earth Day to present differentiated instruction around using circle and bar graphs. Each group gets a cube based on their tiers and works collaboratively as well as...
Curated OER
Graphing in the Information Age
Middle schoolers create a variety of graphs based on population data. In this statistics lesson, students use data that can be gathered on-line to make a bar chart, line graph, and circle graph.
Curated OER
Organizing Data
In this organizing data worksheet, 7th graders solve seven different types of problems related to data. They first identify the type of data as categorical, discrete or continuous from the information given. Then, students use Excel to...
Curated OER
Dealing with Data
Seventh graders collect and analyze data. In the seventh grade data analysis lesson, 7th graders explore and/or create frequency tables, multiple bar graphs, circle graphs, pictographs, histograms, line plots, stem and leaf plots, and...
Curated OER
The Power of Graphical Display: How to Use Graphs to Justify a Position, Prove a Point, or Mislead the Viewer
Analyze different types of graphs with learners. They conduct a survey and determine the mean, median and mode. They then identify different techniques for collecting data.
Futures Channel
Folding Circles
Students investigate properties of circles. In this geometry lesson, students differentiate between similarity and congruence as they observe polygons. They investigate properties of two and three dimensional shape.
Other popular searches
- Percent Circle Graph
- Circle Graph Worksheet
- Circle Graph Template
- Interpreting Circle Graphs
- Circle Graph Protractor
- Circle Graph Activity
- Reading Circle Graphs
- Circle Graphs Pie Charts
- Circle Graph Central Angle
- Bar and Circle Graphs
- Circle Graph in Excel
- Family Budget Circle Graph


