Alabama Learning Exchange
I Know What You Did Last Summer: A Data Graphing Project
Young scholars participate in graphing data. In this graphing data instructional activity, students make a stem and leaf plot of their summer activities. Young scholars create numerous graphs on poster boards. Students discuss the...
Curated OER
Statistics for Graphing
Students use the Internet to access a variety of websites that present statistics and information for use in graphing. They represent sports statistics, geographical measurements, temperatures and more.
Curated OER
Dealing with Data
Seventh graders collect and analyze data. In the seventh grade data analysis lesson, 7th graders explore and/or create frequency tables, multiple bar graphs, circle graphs, pictographs, histograms, line plots, stem and leaf plots, and...
Curated OER
Hollywood's Top Ten
Learners gather data on top 10 highest grossing movies, and make a bar graph and a pictogram.
Curated OER
Comparing School Bus Stats
Engage in a lesson that is about the use of statistics to examine the number of school buses used in particular states. They perform the research and record the data on the appropriate type of graph. Then they solve related word problems.
Curated OER
Data Collection and Presentation
Middle and high schoolers collect and analyze data from four different activities. The activities include information about classmates, tallying colors of cars in a parking lot, stem and leaf plots, and making a histogram from winning...
Curated OER
Dealing With Data
Students collect, organize, and display data using a bar graph, line graph, pie graph, or picture graph. They write a summary describing the data represented and compare the graph to another graph in the class.
Curated OER
Bald Eagle Population Graphing
Pupils create graphs to illustrate the bald eagle population. They identify the population of bald eagles in Minnesota and the United States. They create three graphs to represent the population data including a line, bar, and...
Curated OER
Organizing Data
In this organizing data worksheet, 7th graders solve seven different types of problems related to data. They first identify the type of data as categorical, discrete or continuous from the information given. Then, students use Excel to...
Curated OER
Graphs and money
In this graphs and money worksheet, students complete word problems about different kinds of graphs and money in those graphs. Students complete 10 multiple choice problems.
Curated OER
Statistics of Mars
Students explore the concept of central tendencies. In this central tendencies lesson, students sort M&M's or Skittles based on color. Students graph their results. Students find the mean, median, and mode of their data.
Curated OER
Nine Examples for Tables, Pictographs, Mean. Median, and Mode
In this graphical representation of data and measures of central tendency worksheet, students calculate mean, median, and mode and answer questions related to graphs, tables, and pictographs.
Curated OER
Reading Graphs
Students read graphs and charts to interpret results. In this algebra lesson, students interpret bar, line and pictographs. They draw conclusions and make predicitons based on these charts.
Curated OER
Collecting Data
In this data collection worksheet, students read about how data is collected and organized. They also learn about a hypothesis. Students read through examples of different charts and then answer 23 questions pertaining to data...
Curated OER
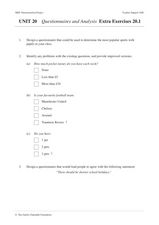
Unit 20 Questionnaires and Analysis Extra Exercises 20.1
In this statistics worksheet, students design a biased questionnaire. They create data displays based on given statistics. There are a total of 9 problems.
Curated OER
Data From Interviews
Students create and conduct a survey about favorite foods, gather and represent the data, interpret data and make predictions to present to the class. They create and use interview questions to gather data. Pupils are explained that...
Curated OER
ou are the Researcher!
Students conduct a census at school. They collect data, tally it, and create a frequency table. Students display their data in three different types of graphs. They write complete sentences describing the graph.
Curated OER
Halloween Graphitti
Pupils complete multi-curricular activities in a Halloween themed lesson. In this Halloween lesson, students examine newspaper ads to find prices of pumpkins and use them to complete a stem and leaf plot. Pupils find the diameter,...
Curated OER
Snack Attack
Learners design charts, tables, graphs, and pictographs to analyse the types of snacks in a bag.
Curated OER
Download and Analyze
Students download information from a NASA website into a database. They transfer it to a spreadsheet by completing the information and analyze the information. They determine temperature averages, mode, and graph the results. They write...
Curated OER
How's the Weather
"How's the Weather?" is an exercise that combines science and math as students graph the weather along the Iditarod Trail. They complete a double-line graph of the weather of a chosen checkpoint over the course of one week. Students...
Curated OER
Questionnaires and Analysis
Students, review the techniques and different types of data analysis as well as how they are expressed, identify why facts and data are needed in conclusion of a questionnaire. The concepts of qualitative and quantitative data are...
Curated OER
Paper Parachutes
Pupils participate in a simulation of a parachute-jump competition by making paper parachutes and then dropping them towards a target on the floor. They measure the distance from the point where the paper parachute lands compared to the...


