Curated OER
Student Heights
Students measure the heights of their fellow classmates and create a box and whisker plot to display the data. In this measurement lesson plan, students analyze the data and record results.
Curated OER
Local Traffic Survey
Students conduct a traffic survey and interpret their data and use graphs and charts to display their results.
Math Worksheets Land
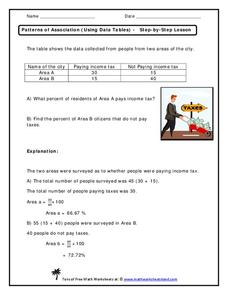
Patterns of Association (Using Data Tables) - Step-by-Step Lesson
This worksheet belongs to a four-part resource that gathers information from data tables to calculate percentages. The page introduces one problem and shares an explanation to the answer.
101 Questions
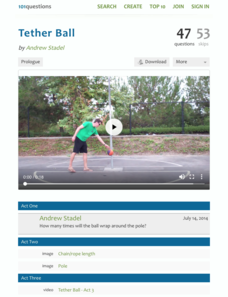
Tether Ball
All work and no play makes for a boring classroom! Bring back memories by analyzing the patterns of a tether ball. Given the dimensions of the ball, pole, and rope, young scholars must determine how many times the ball will wrap around...
Curated OER
Calculator-Based Lessons Help Examine Real-World Data
Students may determine equations based on graphs and regression models.
Curated OER
Applied Science - Science and Math Pre Lab
Students find Fibonacci sequences. In this applied Science lesson, students solve Fibonacci sequence problems. Students explore the mathematical patterns of objects in nature.
Curated OER
EXCEL It!
Students surf the Web gathering information about graphs. The data collected is incorporated into an Excel spreadsheet and graphs of varying nature generated to further enhance student understanding.
Curated OER
Who's On First?
Have you ever considered why the number 10 is so important to us? That's what learners do here. They explore patterns formed by powers of ten and by decimals, convert units of measure within the metric system, and express these in the...
Curated OER
Count The Letters
Students perform activities involving ratios, proportions and percents. Given a newspaper article, groups of students count the number of letters in a given area. They use calculators and data collected to construct a pie chart and bar...
Curated OER
Model and Solve Algebraic Equations
Examine multiple ways to solve algebraic equations. Pupils will generate a problem solving strategy that addresses the prompt given by the teacher. They will then share their problem solving strategy with the class. Graphic organizers,...
Curated OER
The Bigger they Are . . .
Students do a variety of data analyses of real-life basketball statistics from the NBA. They chart and graph rebounding, scoring, shot blocking and steals data which are gathered from the newspaper sports section.
PBS
Working with Coordinate Planes: Assessments
It's time for scholars to show what they know about coordinate planes with a collection of three assessments. The exams' objectives include plotting points on a single grid, measuring using the distance formula, and identifying points on...
Curated OER
"Colors" a poem by Shel Silverstein
Students collect data, graph it, and use the data to find measures of central tendencies, and find probabilities.
Curated OER
Variables and Patterns: Determining an appropriate scale while graphing
Sixth graders determine appropriate scales when graphing data. In this graphing lesson, 6th graders use an the applet "Graph It" to determine what is an appropriate scale for their data.
Bowland
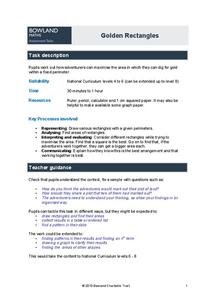
Golden Rectangles
Scholars must determine the maximum area for a rectangular plot of land enclosed with 100 meters of rope. As the work they discover patterns and numerical approaches to solve the problem.
Curated OER
I Wonder How Fast Manduca Grows Compared To Me
Students study the Manduca bug and its growth data. They look for patterns and compare their own growth rate to that of the Manduca.
Curated OER
Tall Tale Rollers
Students explore American tall tales. In this tall tale lesson, students discover the six characteristics that are included in tall tales. Students survey their class to find each student's favorite tall tale character and organize the...
American Statistical Association
How Random Is the iPod’s Shuffle?
Shuffle the resource into your instructional activity repertoire. Scholars use randomly-generated iPod Shuffle playlists to develop ideas about randomness. They use a new set of playlists to confirm their ideas, and then decide whether...
Curated OER
Virtual Field Trip
This hands-on resource has future trip planners analyze graphs of mileage, gasoline costs, and travel time on different routes. While this was originally designed for a problem-solving exercise using a Michigan map, it could be used as a...
Curated OER
Code Breakers
Students collect data and make a frequency table, change ratios into percents, and analyze data to make predictions.
Curated OER
Shedding Light on the Weather with Relative Humidity
Learners study weather using a graphing calculator in this instructional activity. They collect data for temperature and relative humidity for every hour over a day from the newspaper, then place the data in their handheld calculator and...
Curated OER
Temperature High and Lows
Young scholars gather high and low temperature readings through email. In this temperature graphing lesson, students use a spreadsheet to input data for a graph. young scholars interpret the graphs to compare and contrast the data from...
Curated OER
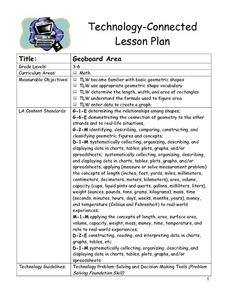
Geoboard Area
Students explore the basic geometric shapes and geometric shape vocabulary through the use of geoboards and virtual geoboards. They create a variety of shapes with a partner, build ten different rectangles on their geoboards, and...
Mathematics TEKS Toolkit
Grade 6: Exploring c/d = pi
Introduce your math class to the perimeter of a circle. Teach them that pi describes the relationship between the circumference and the diameter. As a hands-on investigation, pairs or small groups use string to compare these two values...


