Prince William Network
The Incredible Journey
Divide your school gym into breeding grounds and non-breeding grounds so that your zoologists can play a game simulating the seasonal migration of shorebirds. Players pick one of the included game cards and follow its directions, which...
Energy for Keeps
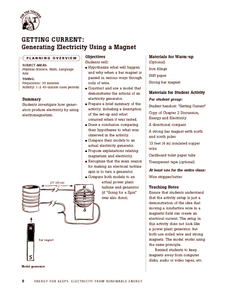
Getting Current: Generating Electricity Using a Magnet
Give your class a magnetic charge with this creative experiment designed to teach emerging scientists about electromagnetism. Pupils construct a model that demonstrates the function of an electrical generator and test this creation in a...
Education Development Center
Area Model Factoring
Introduce learners to what factoring represents and it's relationship to a square with a resource about factoring and the method of area models. The questions are scaffolded to begin with introductory questions and eventually have...
Education Development Center
Points, Slopes, and Lines
Before graphing and finding distances, learners investigate the coordinate plane and look at patterns related to plotted points. Points are plotted and the goal is to look at the horizontal and vertical distances between coordinates and...
Curated OER
Nutria And The Disappearing Marsh
Young analysts examine changes in the nutria population, vegetation density, and marsh area over time in the wetlands of Louisiana. They import data and use the TI-73 Explorer to graph and analyze the effects of nutria on marsh loss.
Curated OER
Winter Olympics History Year by Year
Investigate the history of the Winter Olympic Games. After researching this event and compiling necessary statistics, pupils use a graphic organizer to chart their findings. A template for a chart is included in this resource. Have your...
Curated OER
Put Your Truss in Building Bridges
Students apply abstract concepts, such as stress, fulcrums, the law of gravity, and the strength of different geometric shapes. Groups of student contractors operate simulated architectural firms to create strong, economical bridges.
Curated OER
Interest Rates
Use a KWL chart and discussion to explore the concept behind loans with interest based on percentage rates. Learners examine different types of interest, the history of interest loans and calculate the costs of a loan over a ten-year...
Curated OER
Building Big and Strong
Middle and high schoolers explore the concepts of architectural rigidity. They analyze a variety of polygons, and explain why some shapes add more strength to structures than others. The PBS video, "Building Big," is utilized in this plan.
Curated OER
Swinging Pendulum
Students engage in an activity which demonstrates how potential energy (PE) can be converted to kinetic energy (KE) and back again. Given a pendulum height, students calculate and predict how fast the pendulum will swing by understanding...
Curated OER
Data Analysis
Young statisticians use and interpret measures of center and spread such as mean, median, and mode as well as range. They use box plots to represent their data and answer questions regarding the correspondence between data sets and the...
Curated OER
My Angle on Cooling
Students explore how the angle and distance of an object can change it's temperature. After reviewing how the position of the Earth affects the temperature of the planet, student groups design and perform an experiment to test how...
Curated OER
Super Ticket Sales
Use this graphing data using box and whisker plots lesson to have learners make box and whisker plots about ticket sales of popular movies. They find the mean, median, and mode of the data. Pupils compare ticket sales of the opening...
Curated OER
Curve Ball
Create a Height-Time plot of a bouncing ball using a graphing calculator. Graph height as a function of time and identify the vertex form of a quadratic equation that is generated to describe the ball's motion. Finally, answer questions...
Texas Instruments
Changing Functions
Your algebra 2 learners show what they can do in this assessment activity on shifting, reflecting, and stretching graphs. Given the graphs of various functions, they write the represented equation.
Texas Instruments
Exploring Basic Equations
Learners explore equations with constants, variables and with exponents. They identify and define variables, constants, exponents, expressions, and equations, as well as give an example of each. Your class will also draw their...
Curated OER
A Picture is Worth a Thousand Words
Pupils create various types of graphs. They go to suggested websites to collect data and create graphs to organize the data. Then they answer questions according to their graph.
Curated OER
Goal Setting
Students understand how they can incorporate dietary guidelines in their daily life. For this investigative lesson students set dietary goals and incorporate an activity to learn how to create a new seed variety while studying...
National Security Agency
Ordering, Adding and Subtracting Integers
Prealgebrarians use colored chips, stickers, and pencils to explore the world of integers. They discover absolute value, compare positive and negative integers, and apply operations to them. A detailed procedure for the three-part...
National Security Agency
Money Maters: Integers are Integral!
A thoroughly-written lesson plan and a plethora of worksheets about integers comprise this resource. Neophyte number crunchers learn to recognize integers, add and subtract them, and apply the concepts to the designing of a personal...
Curated OER
Interesting Integers and Exciting Equations
An 80-page resource provides four lessons and all associated worksheets to teach middle schoolers about expressions and equations. The lessons are hands-on, using games, "integer chips," a balance and cubes, and cut and paste activities....
National Security Agency
Classifying Triangles
Building on young mathematicians' prior knowledge of three-sided shapes, this lesson series explores the defining characteristics of different types of triangles. Starting with a shared reading of the children's book The Greedy...
Rainforest Alliance
Investments in Forest Carbon
One hundred metric tons of CO2 can accumulate in one acre of forest over time—that's a lot of carbon! In the activity, groups of middle school learners determine what makes forests important. They then solidify the concept by using a...
Polar Trec
Calorimetry Lab
Young people between the ages of 11–13 need on average about 2,000 calories per day. Within the lab, groups learn about calorimetry and respiration. They explore how it pertains to humans and animals living the Arctic where cold...
Other popular searches
- Math and Science Careers
- Integrated Math and Science
- Science and Math
- Science/ Math Games
- Math and Science Activities
- Integrating Math and Science
- +Math and Science Careers
- Math and Science Plan
- Math and Science Lessons
- Word Origins Science Math
- Math in Science Experiments
- Science Math


