Curated OER
Line and Double Line Graphs: Reteach
In this graphing worksheet, students review the five steps for making a double line graph to display data. Students then use the graph they made following the shapes to answer the three questions.
Curated OER
Mean Absolute Deviation in Dot Plots
The lesson focuses on the ideas of dot plot representations and the mean absolute deviation of data sets.
Curated OER
Scattered About
Middle schoolers are introduced to the concept of scatter plots after reviewing the various types of graphs. In groups, they analyze the type of information one can receive from a scatter plot and identify the relationship between the x...
Curated OER
Graphing Greenery
Students gather leaves and trace them on graph paper. They plot coordinates that approximate the shape of the leaves and share those coordinates as "worksheets" for other students to complete.
Shodor Education Foundation
Data Flyer
Fit functions to data by using an interactive app. Individuals plot a scatter plot and then fit lines of best fit and regression curves to the data. The use of an app gives learners the opportunity to try out different functions to see...
Curated OER
M&Ms; Line Plots and Graphing
Students, using small individual bags of M&Ms, engage in activities including; estimating, sorting, graphing, mean, median, mode, fractions, percentage, and averaging.
Curated OER
You Can Get There From Here - Plotting on a Coordinate Plane
In this plotting worksheet, middle schoolers plot given ordered pairs on a coordinate plane. After plotting each ordered pair, students connect line segments in consecutive order. Upon completion of the graphing exercise, middle...
CCSS Math Activities
Smarter Balanced Sample Items: 6th Grade Math – Claim 4
Develop a model for prep. The resource provides examples of how items reflect modeling and data analysis for Smarter Balanced assessments. Items use on-grade or below-grade content to focus on the modeling aspect. The questions revolve...
EngageNY
Writing and Graphing Inequalities in Real-World Problems
Inequalities: when one solution just doesn't suffice. Individuals learn to write inequalities in real-world contexts and graph solution sets on the number line. All inequalities in the instructional activity are of the form x < c or x...
Curated OER
Shake It Up with Scatterplots
Students identify how to use a scatterplot to compare two sets of data to determine if they are related. Then they identify and describe the definition of regression line (the "line of best fit"). Students also identify how scientists...
Illustrative Mathematics
Walk-a-thon 1
Your mathematician's job is to explore the relationship between hours and miles walked during a walk-a-thon. The activity compels your learners to experiment with different means in finding out this proportional relationship. The answer...
Scholastic
Study Jams! Choosing the Correct Graph
With so many types of graphs, don't let your learners get stuck figuring out which one to use. To track how Zoe spent her allowance, use this interactive lesson to review all the types of graphs and pick the best one to display the data....
West Contra Costa Unified School District
Comparing Data Displays
There is so much more to data than just numbers, and this resource has learners use three methods of comparing data in a multi-faceted lesson. The 21-page packet includes a warm-up, examples, an activity, and assessment for a complete...
Curated OER
Plot the x-y Coordinates on the Grids Below
In this coordinate grid graphing worksheet, students plot the given points onto each of 6 coordinate grids. All points are located in quadrant 1. One point is plotted on each grid. Answers are given by clicking the appropriate place on...
Curated OER
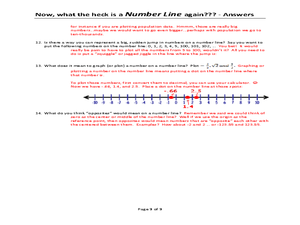
Now, what the heck is a NUMBER LINE again???
A unique approach to reviewing number lines and how to locate different values on them, this instructional activity poses several questions that require written answers rather than calculations. You could use this as a note-taking guide...
American Statistical Association
Scatter It! (Using Census Results to Help Predict Melissa’s Height)
Pupils use the provided census data to guess the future height of a child. They organize and plot the data, solve for the line of best fit, and determine the likely height and range for a specific age.
American Statistical Association
What Fits?
The bounce of a golf ball changes the result in golf, mini golf—and a great math activity. Scholars graph the height of golf ball bounces before finding a line of best fit. They analyze their own data and the results of others to better...
Balanced Assessment
A Fishy Story
There's nothing fishy about this resource. In the task, learners use given information about fish prices to create a scatter plot and line of best-fit. Later, they use the information to answer questions about the profit from fish sales.
Kuta Software
Points in the Coordinate Plane
Keep young mathematicians on point with this coordinate plane worksheet. From plotting ordered pairs to identifying the quadrant and coordinates of specific points, this resource covers all the basic skills students need to have when...
Noyce Foundation
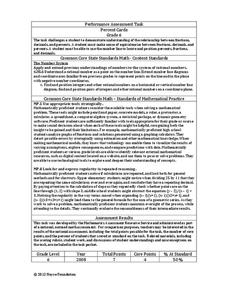
Percent Cards
Explore different representations of numbers. Scholars convert between fractions, decimals, and percents, and then use these conversions to plot the values on a horizontal number line.
Kenan Fellows
Let's Move
Find a statistical reason for a fresh start. Using a hypothetical scenario, individuals research statistical data of three different cities. Their goal? Find the best statistical reason for a business to move to a new location. Their...
Math Worksheets Land
Halloween Cartesian Art: Bat
Get the class batty over graphing. Young mathematicians plot ordered pairs in all quadrants of a Cartesian plane, and connect the points to create a bat.
Curated OER
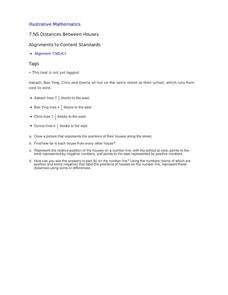
Distances Between Houses
This resource sneaks in the math so your learners will be adding and subtracting positive and negatives on a number line while thinking they are mapping out houses. The activity starts by putting houses the appropriate distance away from...
Curated OER
Straight Line Graphs
Students discover certain equations produce straight lines. In this graphing lesson, students draw axis and problem solve to find coordinates to graph.
Other popular searches
- Frequency Tables Line Plots
- Line Plots Grade 3
- Math Line Plots
- Christmas Line Plots
- Line Plots and Tallies
- Activities Using Line Plots
- Data Analysis Line Plots
- Human Line Plots
- Ell Math Line Plots
- Line Plots With Airplanes
- Charts, Tables, Line Plots
- Charts Tables Line Plots


