Curated OER
Identifying Linear Functions from Graphs
Keep your mathematicians engaged using this group linear functions activity. Each of ten groups receives two graphs with both an image and equation, as well as a "who has" phrase to call out the next graph. Scholars stay on their toes as...
Mathematics Assessment Project
Linear Graphs
A line is a line is a line. As a middle school assessment task, learners first identify graphs of given linear equations. They then identify the equations that represent real-world situations.
EngageNY
From Ratio Tables, Equations and Double Number Line Diagrams to Plots on the Coordinate Plane
Represent ratios using a variety of methods. Classmates combine the representations of ratios previously learned with the coordinate plane. Using ratio tables, equations, double number lines, and ordered pairs to represent...
Texas Instruments
Exploring Basic Equations
Learners explore equations with constants, variables and with exponents. They identify and define variables, constants, exponents, expressions, and equations, as well as give an example of each. Your class will also draw their...
Florida Center for Instructional Technology
A Human Number Line: Teacher Notes
Twenty-one pieces of tagboard can lead your class to a greater understanding of integers when you use them to form a human number line. After creating this math tool, two strategies for adding and subtracting will have your...
Curated OER
Exploring Linear Equations: Student Worksheet
An activity around linear equations, slope, and intercept is here for you. In it, young mathematicians engage in a whole-class activity while the teacher uses the overhead projector graphing calculator. This activity also focuses on...
Curated OER
Interactivate - Lines, Rays, Line Segments, and Planes
Young scholars explore lines, rays, line segments, and planes. For this math lesson, students discuss the math concepts and direct their instructor in graphing functions. Young scholars collaborate in graphing additional functions.
Curated OER
Slope-Intercept Form of a Line
Using the subscriber website Explorelearning.com, young mathematicians observe changes in the slope and y-intercept and their effect on the graph of lines. This activity helps young scholars develop an intuitive sense of the connection...
Curated OER
Linear Equations
Middle and high schoolers complete problems with linear equations and then graph the lines they represent. They complete eight problems.
Education Development Center
Points, Slopes, and Lines
Before graphing and finding distances, learners investigate the coordinate plane and look at patterns related to plotted points. Points are plotted and the goal is to look at the horizontal and vertical distances between coordinates and...
Curated OER
Walking the Plank
This is a cool math activity. Kids collect and interpret data based on a physical act. A board is balanced between a scale and a step, learners record a peer's weight as it decreases while s/he walks further away from the scale. They...
Curated OER
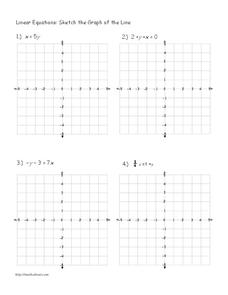
Linear Equations: Sketch the Graph of the Line
For this linear equations worksheet, 6th graders complete 4 problems, sketching the graphs of lines of equations. A reference web site is given for additional activities.
Curated OER
Lines, Rays, Line Segments, and Planes
Learners are introduced to lines, rays, line segments and planes. They explore the differences between lines, rays, line segments and planes. Students pracice graphing lines, rays, line segments and planes.
Virginia Department of Education
Give or Take a Few
Young mathematicians extend their knowledge of rational numbers on a number line to graph inequalities by first using number cards to compare rational numbers. They finish by using similar reasoning to graph inequalities on a number line.
Math Drills
Thanksgiving Cartesian Art: Pumpkin
Not a Halloween jack-o-lantern, but a Thanksgiving pumpkin! Young mathematicians graph and connect points on a coordinate system to unveil the mystery picture.
Curated OER
Exploring Linear Equations And Scatter Plots - Chapter 5 Review
Students complete rolling stocks experiment, and collect and enter data on the computer. They enter data on graphing calculators, complete scatter plot by hand with line of best fit, and discuss different graphing methods.
Curated OER
Functions and Graphing
Graphing functions in a real world application makes math come to life. Learners graph points on a coordinate plane and identify various points on a graph by working through a set of real world problems. This is a perfect review exercise.
CK-12 Foundation
Input-Output Tables for Function Rules
How does changing a graph affect the function? Learners watch the changing input-output table as they adjust the location of the line graph. Questions prompt them to complete a table of values and determine the function rule.
Curated OER
Introduction to Representing and Analyzing Data
Represent data graphically. Allow your class to explore different methods of representing data. They create foldables, sing songs, and play a dice game to reinforce the measures of central tendency.
Curated OER
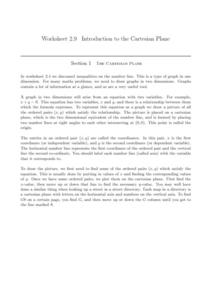
The Cartesian Plane
Learners solve and complete 22 various types of problems. First, they find the gradients of the lines and plot the given points. Then, they complete the table of values for each equation and use the table to draw the graph.
Illustrative Mathematics
Sore Throats, Variation 2
What does math have to do with a sore throat? When you mix water and salt you have a great review of how to represent proportional relationships by an equation or graph. Here the proportions of the mixtures may be different, but the...
Curated OER
Affine Recurrence Plotter
Learners use the on-line affine recurrence plotter to graph equations. They work on-line to create graphs of trout in a trout pond and savings account balances when interest is compounded over time. Links to the four one-day lessons are...
Curated OER
The Coordinate Plane
Use this Saxon math coordinate plane worksheet to have your learners utilize a graphing calculator, equate the vertices of a rectangle, and then graph their conclusions as well as answer a variety of fill in the blank equations.
Curated OER
Balancing Equations and Using a Pyramid
Sixth graders complete worksheets and make journal entries to interpret mathematical expressions about the pyramids. In this equality by balancing equations lesson, 6th graders participate in groups or by themselves to complete exercises...


