Curated OER
Surveys
Students collect data from middle school survery. They tabulate percentages by grade level. They create a graph to display the survey results.
Curated OER
Tables, Charts and Graphs
Students examine a science journal to develop an understanding of graphs in science. In this data analysis lesson, students read an article from the Natural Inquirer and discuss the meaning of the included graph. Students create a...
Curated OER
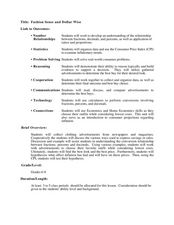
Fashion Sense and Dollar Wise
Students work in groups to show understanding of the relationship between fractions, decimals, percentages, and the application of ratios and proportions. In this decimals, fractions, and percents lesson, students use real life consumer...
Curated OER
Cumulative Frequency
In these word frequency worksheets, students choose a page from a newspaper and count the number of letters in each word and complete their results in a table. Students then calculate the mean number of letters. Students then collect...
Curated OER
What's Your Favorite? Survey And Graphing Project
Sixth graders create and edit spreadsheet documents using all data types, formulas and functions, and chart information. They collect and organize data that be portrayed in a graph that they create using EXCEL.
Curated OER
Collecting the Rays
Pupils investigate the affect shape has on the ability of a solar panel to collect sunlight. In this collecting sunlight using a solar panel lesson plan, students determine which solar panel shape collects the most sunlight. Pupils use...
Curated OER
What's the Scoop?: Our Favourite Ice Cream Flavours
Sixth graders create a spreadsheet on the favorite ice cream flavors of their peers. They interview their classmates, documenting their findings on a "Favorite Flavors" spreadsheet. Students graph and analyze the data.
Curated OER
The People of Kansas: Where did they come from and why did they come?
Students review census data to correlate to emigration in Kansas. In this Westward Expansion lesson, students analyze a painting and create definitions for emigration and discuss why people emigrate. Students read and analyze 1855 census...
Curated OER
The Appearance of a Graph
Sixth graders understand that the appearance and increment used on the x and y axis in a graph change how it looks. In this graphing instructional activity, 6th graders work in pairs and interpret graphs using different axes. Students...
Curated OER
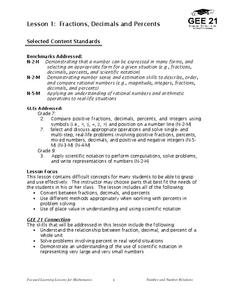
Fractions, Decimals, and Percents
Pupils connect different mathematical concepts. They create a circle graph. Students then create a question in which they collect data in order to convert fractions to decimals and decimals to percents.
Curated OER
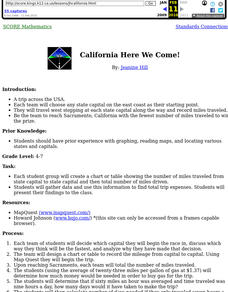
California Here We Come!
A highly relevant and great cross-curricular project! In teams, your class will plot a course from the East Coast to Sacramento, California passing through all of the state capital cities along the way. As part of the journey, teams will...
Curated OER
Student-Led Parent Conference
Students prepare for student-led parent conferences. In this communication instructional activity, students collect data to build portfolios for use during parent conferences. Students practice their presentations in preparation for the...
Curated OER
Energy Conservation
Students investigate energy conservation. In this energy conservation and analyzing data lesson, students identify and explain several energy sources and research renewable and nonrenewable energy sources. Students use statistics form...
Newspaper Association of America
By the Numbers: Mathematical Connections in Newspapers for Middle-Grade Students
A cross-curricular resource teaches and reinforces mathematical concepts with several activities that use parts of a newspaper. Scholars use scavenger hunts to find the different ways math is used in the paper along with using data...
Curated OER
Jabberwocky: A Lake and Island Board Project
A mathematical role play using Lake and Island Boards where students plan to move from Jabberwocky to their new planet
Curated OER
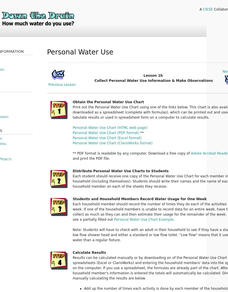
Down the Drain: How Much Water Do You Use?
Participate in an Internet-based project to share information about water usage with other students. Collect information about water usage and compare it to the average used by people in other parts of the world.
American Statistical Association
How Random Is the iPod’s Shuffle?
Shuffle the resource into your instructional activity repertoire. Scholars use randomly-generated iPod Shuffle playlists to develop ideas about randomness. They use a new set of playlists to confirm their ideas, and then decide whether...
Curated OER
Virtual Field Trip
Are we there yet? Young trip planners learn about their state and plan a trip. They will select sites to see in three cities in their state, and record associated costs in a spreadsheet. While this was originally designed as a...
Alabama Learning Exchange
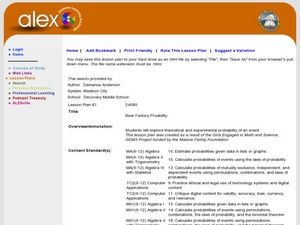
Bear Factory Probability
By examining a set of dice roll data, statisticians determine the probability of different sums occurring. They visit an interactive website and determine how many different vacation outfits Bobbie Bear will have based on the colored...
Curated OER
Statistical Sampling
Students collect data in the field and analyze it in class using tables and graphs to determine how many observations of a phenomenon are necessary to draw valid conclusions.
Curated OER
Design-A-Room Project (Part 3 of 3)
Learners culminate a unit on measurement with a focus on area and perimeter. They design a floor plan of their dream room on graph paper showing the proper area and perimeter. They plan the budget for their room and make a 3-D scale...
Curated OER
Decisions, Decisions, Decisions
Students examine graphs to find the most appropriate for various kinds of data. In this graphing lesson, student create bar, line and circle graphs. Students create graphs electronically and manually interpreting the data.
Curated OER
The Trash We Pass
Where does our garbage go? What is the difference between a recyclable and non-recyclable item? Pose these important, but often overlooked, questions to your class and invite them to consider the lasting and damaging effects of the...
Curated OER
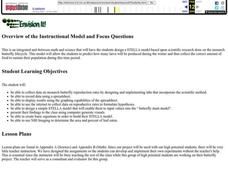
Overview of the Instructional Model and Focus Questions
Students design STELLA model based upon scientific research done on monarch butterfly lifecycle; model allows students to predict how many larva will be produced during the winter and thus collect the correct amount of food to sustain...


