EngageNY
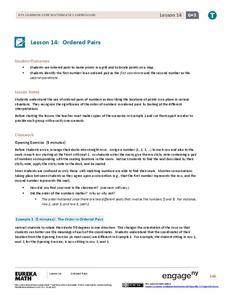
Ordered Pairs
Scholars learn to plot points on the coordinate plane. The lesson introduces the idea that the first coordinate of a coordinate pair represents the horizontal distance and the second coordinate represents the vertical distance.
EngageNY
Describing Distributions Using the Mean and MAD
What city has the most consistent temperatures? Pupils use the mean and mean absolute deviation to describe various data sets including the average temperature in several cities. The 10th instructional activity in the 22-part series asks...
EngageNY
Summarizing a Data Distribution by Describing Center, Variability, and Shape
Put those numbers to work by completing a statistical study! Pupils finish the last two steps in a statistical study by summarizing data with displays and numerical summaries. Individuals use the summaries to answer the statistical...
Curated OER
Converting Currency - Level 2
In this basic mathematics worksheet, students apply the exchange rate shown to convert various amounts into euros. They also apply the same exchange rate to convert various amount into Pounds. Finally, students solve three word problems...
Jordan School District
Picture Frames and Algebra
Middle schoolers create a method for finding the area of a fame for a picture and then transfer their shared methods into algebraic expressions. They develop the algebraic language to communicate and solve problems effectively and...
Curated OER
Take Math Shopping!
Percents, estimation, and comparative analysis become more understandable when they are used in-context at the grocery store.
Bowland
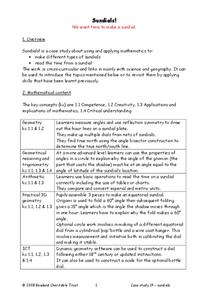
Sundials!
Time to learn about sundials. Scholars see how to build sundials after learning about Earth's rotation and its relation to time. The unit describes several different types of possible sundials, so choose the one that fits your needs — or...
Bowland
Alien Invasion
Win the war of the worlds! Scholars solve a variety of problems related to an alien invasion. They determine where spaceships have landed on a coordinate map, devise a plan to avoid the aliens, observe the aliens, and break a code to...
Curated OER
Starting With Stats
Statisticians analyze a data set of student IQs by finding measures of central tendency and dispersion such as mean, median, mode, and quartiles. They practice using a graphing calculator to find the values and analyze box plots and...
Mathematics Assessment Project
Taxi Cabs
A simple real-world problem involving taxi cab fares is used to practice the multplicaiton and division of integers. How many of two different-sized taxis are needed to transport 75 people to the airport? What is the least...
Mathematics Assessment Project
Division
When you divide two integers you can get a decimal form of a rational number that repeats. How do you interpret that number in real-world situations? Her is an example question: What does 2.6666666666 mean in terms of an amount of...
Mathematics Assessment Project
Octagon Tile
A connecting-the-dots activity seems too easy for seventh grade but connecting vertices may prove a challenge. Class members first examine a figure created by drawing squares around the inside of an octagon and connecting the...
Mathematics Assessment Project
Temperatures
As a middle school assessment task, learners first examine line graphs of monthly temperatures for two locations, and then match box plots to each line plot.
Curated OER
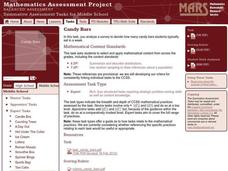
Candy Bars
There is often more to data than meets the eye. Scholars learn that they need to analyze data before making conclusions as they look at data that describes the number of candy bars boys and girls eat. They disprove a given conclusion and...
Workforce Solutions
Miniature Gulf Coast Project
Scholars show what they know about data collection and analysis with an activity that examines a smaller population of Houghton, Texas. Independently or in pairs, learners identify their research question, gather, graph, and analyze...
Curated OER
Computation with Fractions
Upper graders are introduced to the topic of fractions and percentages. In groups, they discuss real world situations in which fractions are present, and they complete a worksheet solving problems with common and uncommon denominators....
Curated OER
Minnesota-China Connections:What Time Is It?
Learners calculate the time difference between Beijing, China and their local community. They discuss how time difference affects intercultural communication.
Curated OER
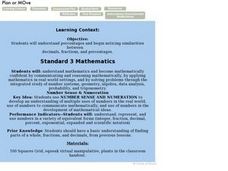
Plan or Move
Students note the similarities between decimals, fractions and percentages. They practice converting numbers between these types. They participate in an activity as well.
Curated OER
Class of Gold
How can you see a number in nature? Here, learners discover both Fibonacci numbers and the golden ratio by exploring a number of different resources. Note: Some of the resources are older and may be missing some of the links, but...
Curated OER
Measurement
Pupils create two prisms out of the same paper. They calcuate the number of centimeter cubes needed to fill each prism. They discover the concept of volume.
Curated OER
Adding and Subtracting Algebraic Expressions (Combining Like Terms)
Everyone loves math when it includes food! This lesson tries to take the notion of combining like terms in algebra and comparing it to sorting apples and oranges. It takes a step-by-step approach to helping young scholars understand this...
Curated OER
Games for Probability: In-Class and Powerball Simulation
Your soon-to-be statisticians play a game to understand the difference between independent and dependent experiments and probability. They draw colored cubes from a bag and then, by either replacing the cube in the bag, or not, for each...
Curated OER
Mr. Cobbler's Shoe Dilemma
Pupils employ statistics to solve real-world problems. They collect, organize and describe data. They make inferences based on data analysis. They construct, read, and interpret tables, charts and graphs.
Curated OER
Flag Pole
Students determine the length of rope on a flagpole and the cost to replace the rope. They create their own real life math problems.
