American Statistical Association
What Fits?
The bounce of a golf ball changes the result in golf, mini golf—and a great math activity. Scholars graph the height of golf ball bounces before finding a line of best fit. They analyze their own data and the results of others to better...
David Pleacher
Candy Math Fun
Few things can motivate children to learn like the promise of a sweet and tasty treat. Given a bag of M&M®s, Skittles®, or other colorful candy, students first predict the contents of the bag before counting the pieces, creating a...
Curated OER
Reading Graphs
Students practice plotting functions on the Cartesian coordinate plane, see several categories of functions, including lines and parabolas, and read a graph, answering questions about the situation described by the graph
Curated OER
Graphs: All About Our Class
Learners respond to survey questions, discuss results, brainstorm ways to represent survey information, and create table of class results. They find mean, range, and percentages, and create graph to display results.
Curated OER
Box and Whiskers
Middle schoolers discover how to relate collected data with a box and whiskers graph in a number of formats. They collect, organize, create, and interpret a box and whiskers graph. Pupils interpret the difference between sets of data,...
Curated OER
No Title
Sixth graders, after reviewing and studying the basics of recording, analyzing and presenting data, create on graph paper a bar or line graph to represent given data and then interpret the data. They answer questions about the given data...
Curated OER
Data Collection - Primary Poster
Students explore the concept of collecting, analyzing, and graphing data. In this collecting, analyzing, and graphing data lesson, students create a survey about a topic of interest. Students poll their classmates, analyze, and graph...
Curated OER
Challenge: Graphing Functions
Here is a functions activity in which learners solve functions containing variables, graph the coordinates, and answer two questions about it. They complete 14 functions.
Curated OER
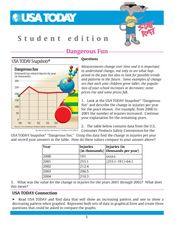
Dangerous Fun
In this line graph worksheet, students analyze the data on a graph about toy-related injuries by year. Students solve 5 problems in which the change in injuries per year is calculated and recorded on a table.
Curated OER
Data Analysis Challenge
In this data analysis worksheet, young scholars work with a partner to collect information for a survey. The information is then compiled into a graph. Learners must indicate their survey question, the target audience, predict the...
Curated OER
Decisions, Decisions, Decisions
Students examine graphs to find the most appropriate for various kinds of data. In this graphing lesson, student create bar, line and circle graphs. Students create graphs electronically and manually interpreting the data.
Curated OER
Which Amusement Park Would You Choose?
Students analyze data related to amusement parks and create a spreadsheet to display the data. They read the data and predict which amusement park they think is safer, create a spreadsheet and graph, and write a proposal based on their...
Utah Education Network (UEN)
Mathematics: Growing Patterns
Learners graph growing patterns using ordered pairs on a coordinate grid. They read The Fly on the Ceiling, a Math Myth.
PBS
Working with Coordinate Planes: Activities and Supplemental Materials
Seven activities make up a collection of supplemental materials to reinforce graphing on a coordinate plane. Worksheet objectives include plotting coordinates within single and four quadrants, measuring straight and diagonal lines, and...
American Statistical Association
Scatter It! (Using Census Results to Help Predict Melissa’s Height)
Pupils use the provided census data to guess the future height of a child. They organize and plot the data, solve for the line of best fit, and determine the likely height and range for a specific age.
Curated OER
Download and Analyze
Students download information from a NASA website into a database. They transfer it to a spreadsheet by completing the information and analyze the information. They determine temperature averages, mode, and graph the results. They write...
Curated OER
Fossil Fuels and Its Effects On The World
Middle schoolers explore the effects of a declining fossil fuel system would have on the world. They read the line graph and other information to answer questions about fossil fuels. Students use mathematics to analyze graphical data...
Curated OER
Mean, Median, Mode, etc.
Explore the concept of mean, median, and mode with pupils. They estimate the length of a string or the number of M&M's in a jar. Then find the mean, median, and mode of the class' estimates.
Curated OER
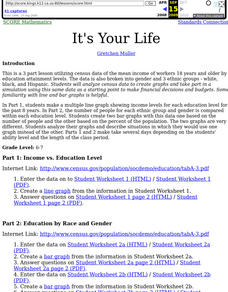
It's Your Life
Students make a multiple line graph showing income levels for each education level for the past 8 years and the number of people for each ethnic group and gender is compared within each education level.
Curated OER
Show Me!
Learners analyze and interpret graphs. In this graphing lesson, students view a video and construct their own graphs (line, circle, bar) from given sets of data.
Curated OER
Scattered About
Middle schoolers are introduced to the concept of scatter plots after reviewing the various types of graphs. In groups, they analyze the type of information one can receive from a scatter plot and identify the relationship between the x...
Curated OER
CEEnBoT Stories
Students identify the slope of a line as negative, positive, zero or undefined. In this algebra lesson, students identify the distance versus the time using graphs of linear equation. They use the robot and the CEENBoT program to analyze...
Curated OER
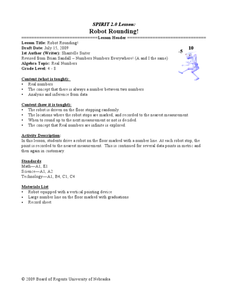
Robot Rounding!
Young scholars collect data on a robot and relate the behavior to prove there is an infinite minute set of numbers. In this algebra lesson plan, students verify that there is always a number between two numbers. They analyze and make...
Curated OER
Atlatl Lessons Grades 4-12: Lesson for Beginning Users of Atlatl
Sixth graders determine the mean, range median and mode of a set of numbers and display them. In this data lesson students form a set of data and use computer spreadsheet to display the information. They extend of the process by looking...


