Mathematics Assessment Project
Mean, Median, Mode, and Range
What a find! Here is a lesson plan, designed to meet sixth grade math Common Core standards, that focuses on the calculation of different measures of center for the scores from a penalty shoot-out competition. An independent...
Curated OER
Ice Cream
Students explore the concepts of mean, median, mode, and range as they elicit data about people's favorite flavor of ice cream. A practical application of the data obtained offers an extension to the lesson plan.
Alabama Learning Exchange
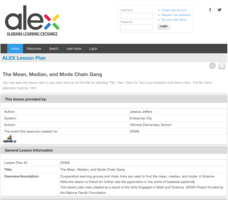
The Mean, Median, and Mode Chain Gang
Students analyze a set of data. They work in cooperative groups and use chain links to identify the mean, median, and mode of the chain.
Laboratory for Atmospheric and Space Physics
Growing Up With A Mission
New Horizons began its journey to Pluto in 2006. Ten years later, it continues its mission. In that time, scholars have surely grown, but how much more will they grow by the time New Horizons reaches its destination? Find out with an...
Shodor Education Foundation
Plop It!
Build upon and stack up data to get the complete picture. Using the applet, pupils build bar graphs. As the bar graph builds, the interactive graphically displays the mean, median, and mode. Learners finish by exploring the changes in...
Shodor Education Foundation
Skew Distribution
Slide the class into a skewed view. Learners alter the location of the median relative to the mean of a normal curve to create a skew distribution. They compare the curve to a histogram distribution with the same skewness.
Newspaper Association of America
Power Pack: Lessons in Civics, Math, and Fine Arts
Newspaper in Education (NIE) Week honors the contributions of the newspaper and is celebrated in the resource within a civics, mathematics, and fine arts setting. The resource represents every grade from 3rd to 12th with questions and...
Education Development Center
Creating Data Sets from Statistical Measures
Explore the measures of central tendency through a challenging task. Given values for the mean, median, mode, and range, collaborative groups create a set of data that would produce those values. They then critique other answers and...
Shodor Education Foundation
Measures
Take a look at data from a statistical lens. An interactive allows pupils to enter data set, labeling the data including the units used. Manipulating the applet, learners select the statistics to calculate that include total, mean,...
Math Stars
Math Stars: a Problem-Solving Newsletter Grade 7
Put on your thinking caps because middle school math has never been more interesting in this huge resource full of thought provoking questions. Written as a newsletter, the resource has 10 two-page newsletters with a variety of...
American Statistical Association
What is the Probability of “Pigging Out”
Learners apply their understanding of luck to a probability experiment. They play a game of Pass the Pigs to determine the probability of a specific outcome. Using analysis for their data, pupils declare the measures of center, dot...
Workforce Solutions
Miniature Gulf Coast Project
Scholars show what they know about data collection and analysis with an activity that examines a smaller population of Houghton, Texas. Independently or in pairs, learners identify their research question, gather, graph, and analyze...


